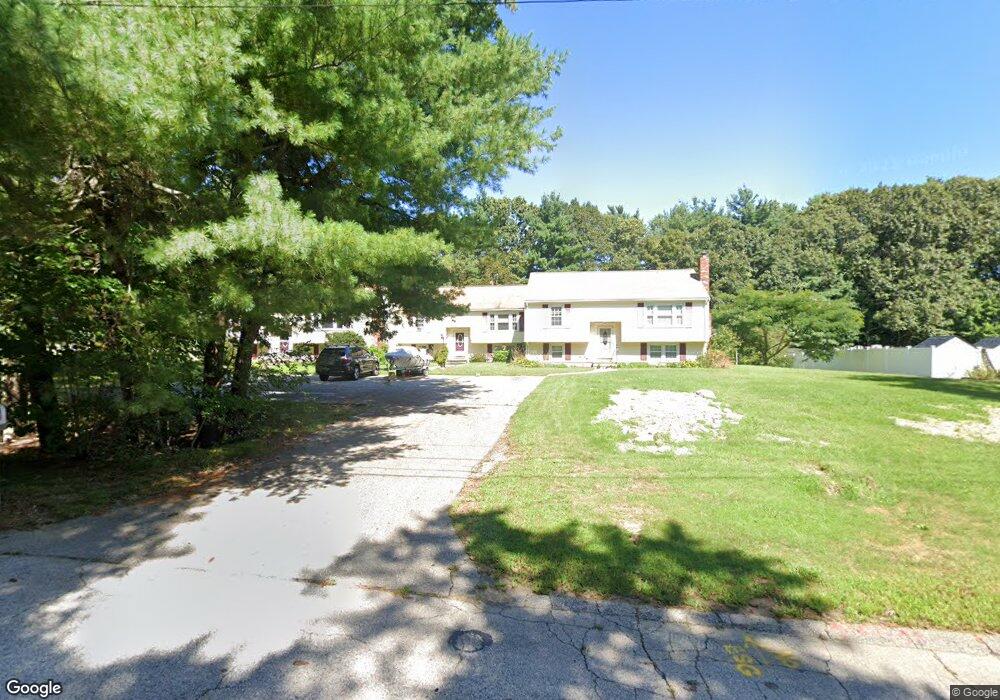
35 Clark Rd Wrentham, MA 02093
Estimated Value: $363,011 - $503,000
2
Beds
2
Baths
922
Sq Ft
$437/Sq Ft
Est. Value
About This Home
This home is located at 35 Clark Rd, Wrentham, MA 02093 and is currently estimated at $402,753, approximately $436 per square foot. 35 Clark Rd is a home located in Norfolk County with nearby schools including Delaney Elementary School, Charles E Roderick, and Discovery Daycare Center.
Ownership History
Date
Name
Owned For
Owner Type
Purchase Details
Closed on
Dec 8, 2003
Sold by
Klingaman Sean P and Klingaman Elizabeth M
Bought by
Luce David A and Luce Lisa A
Current Estimated Value
Home Financials for this Owner
Home Financials are based on the most recent Mortgage that was taken out on this home.
Original Mortgage
$180,000
Outstanding Balance
$84,282
Interest Rate
6.03%
Mortgage Type
Purchase Money Mortgage
Estimated Equity
$318,471
Purchase Details
Closed on
Feb 27, 1998
Sold by
Latham Tracey L
Bought by
Klingman Elizabeth M and Klingman Sean P
Home Financials for this Owner
Home Financials are based on the most recent Mortgage that was taken out on this home.
Original Mortgage
$97,200
Interest Rate
6.85%
Mortgage Type
Purchase Money Mortgage
Purchase Details
Closed on
Jan 20, 1988
Sold by
Volpicelli J A
Bought by
Macklin Louise B
Create a Home Valuation Report for This Property
The Home Valuation Report is an in-depth analysis detailing your home's value as well as a comparison with similar homes in the area
Purchase History
| Date | Buyer | Sale Price | Title Company |
|---|---|---|---|
| Luce David A | $225,000 | -- | |
| Klingman Elizabeth M | $108,000 | -- | |
| Macklin Louise B | $135,900 | -- |
Source: Public Records
Mortgage History
| Date | Status | Borrower | Loan Amount |
|---|---|---|---|
| Open | Macklin Louise B | $180,000 | |
| Previous Owner | Macklin Louise B | $97,200 |
Source: Public Records
Tax History
| Year | Tax Paid | Tax Assessment Tax Assessment Total Assessment is a certain percentage of the fair market value that is determined by local assessors to be the total taxable value of land and additions on the property. | Land | Improvement |
|---|---|---|---|---|
| 2025 | $2,954 | $254,900 | $0 | $254,900 |
| 2024 | $3,059 | $254,900 | $0 | $254,900 |
| 2023 | $3,300 | $261,500 | $0 | $261,500 |
| 2022 | $3,032 | $221,800 | $0 | $221,800 |
| 2021 | $2,894 | $205,700 | $0 | $205,700 |
| 2020 | $2,823 | $198,100 | $0 | $198,100 |
| 2019 | $2,797 | $198,100 | $0 | $198,100 |
| 2018 | $2,922 | $205,200 | $0 | $205,200 |
| 2017 | $2,816 | $197,600 | $0 | $197,600 |
| 2016 | $2,746 | $192,300 | $0 | $192,300 |
| 2015 | $2,425 | $161,900 | $0 | $161,900 |
| 2014 | $2,479 | $161,900 | $0 | $161,900 |
Source: Public Records
Map
Nearby Homes
- 40 Alderbrook Ct
- 10 Nature View Dr
- 15 Nature View Dr
- 215 South St
- 35 Meadowbrook Dr
- 2 Earle Stewart Ln
- 14 Earle Stewart Ln Unit Lot 3
- 8 Weber Farm Rd Unit 8
- 723 Dedham St
- 131 Washington St Unit 32
- 131 Washington St Unit 42
- 131 Washington St Unit 50
- 131 Washington St Unit 51
- 8 Conway Ln
- 9 Sharon Ave
- 11 Sharon Ave
- 0 W Birch Rd
- 112 Taunton St
- 7 Hill St Unit 12
- 71 Pond St
Your Personal Tour Guide
Ask me questions while you tour the home.