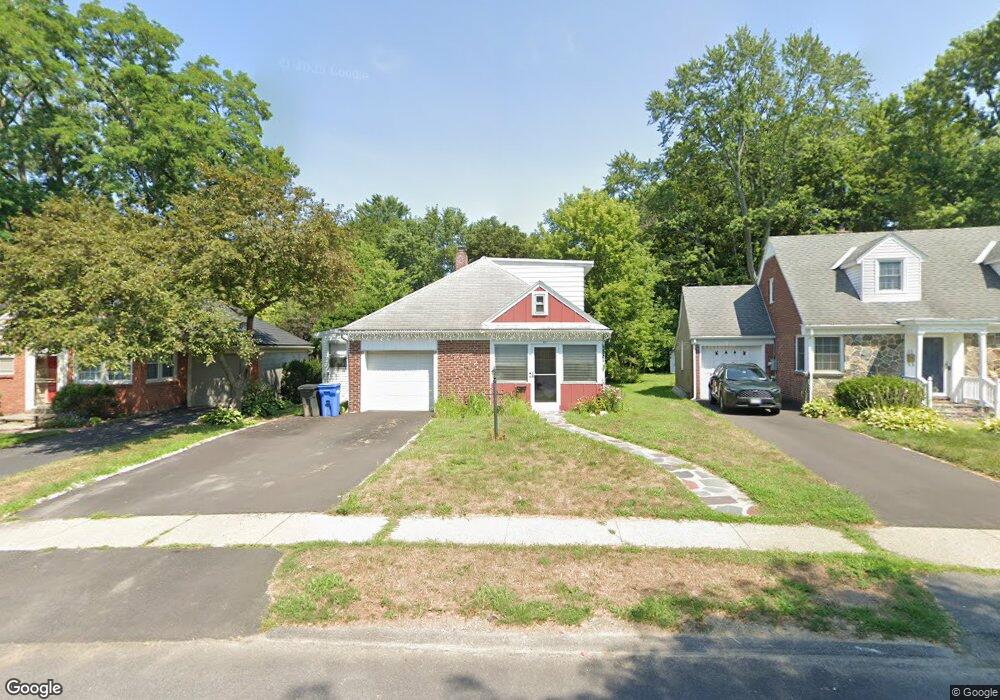
35 Crescent Dr Albany, NY 12208
Buckingham Lake-Crestwood NeighborhoodEstimated Value: $295,000 - $361,000
5
Beds
2
Baths
1,952
Sq Ft
$172/Sq Ft
Est. Value
About This Home
This home is located at 35 Crescent Dr, Albany, NY 12208 and is currently estimated at $335,355, approximately $171 per square foot. 35 Crescent Dr is a home located in Albany County with nearby schools including New Scotland Elementary School, William S Hackett Middle School, and Albany High School.
Ownership History
Date
Name
Owned For
Owner Type
Purchase Details
Closed on
May 23, 2022
Sold by
Simonilan Lean and Ouerdofr Gary R
Bought by
Simonian Lean
Current Estimated Value
Purchase Details
Closed on
Dec 26, 2012
Sold by
Overdorf Gary R
Bought by
Simonian Leah and Overdorf Gary R
Home Financials for this Owner
Home Financials are based on the most recent Mortgage that was taken out on this home.
Original Mortgage
$140,000
Interest Rate
3.35%
Create a Home Valuation Report for This Property
The Home Valuation Report is an in-depth analysis detailing your home's value as well as a comparison with similar homes in the area
Home Values in the Area
Average Home Value in this Area
Purchase History
| Date | Buyer | Sale Price | Title Company |
|---|---|---|---|
| Simonian Lean | -- | None Available | |
| Simonian Leah | $127,500 | None Available |
Source: Public Records
Mortgage History
| Date | Status | Borrower | Loan Amount |
|---|---|---|---|
| Previous Owner | Simonian Leah | $140,000 |
Source: Public Records
Tax History Compared to Growth
Tax History
| Year | Tax Paid | Tax Assessment Tax Assessment Total Assessment is a certain percentage of the fair market value that is determined by local assessors to be the total taxable value of land and additions on the property. | Land | Improvement |
|---|---|---|---|---|
| 2024 | $6,695 | $277,000 | $55,400 | $221,600 |
| 2023 | $4,847 | $134,000 | $27,000 | $107,000 |
| 2022 | $4,664 | $134,000 | $27,000 | $107,000 |
| 2021 | $4,628 | $134,000 | $27,000 | $107,000 |
| 2020 | $4,446 | $134,000 | $27,000 | $107,000 |
| 2019 | $5,276 | $134,000 | $27,000 | $107,000 |
| 2018 | $4,446 | $134,000 | $27,000 | $107,000 |
| 2017 | $1,945 | $134,000 | $27,000 | $107,000 |
| 2016 | $4,318 | $134,000 | $27,000 | $107,000 |
| 2015 | $4,787 | $148,000 | $48,500 | $99,500 |
| 2014 | -- | $148,000 | $48,500 | $99,500 |
Source: Public Records
Map
Nearby Homes