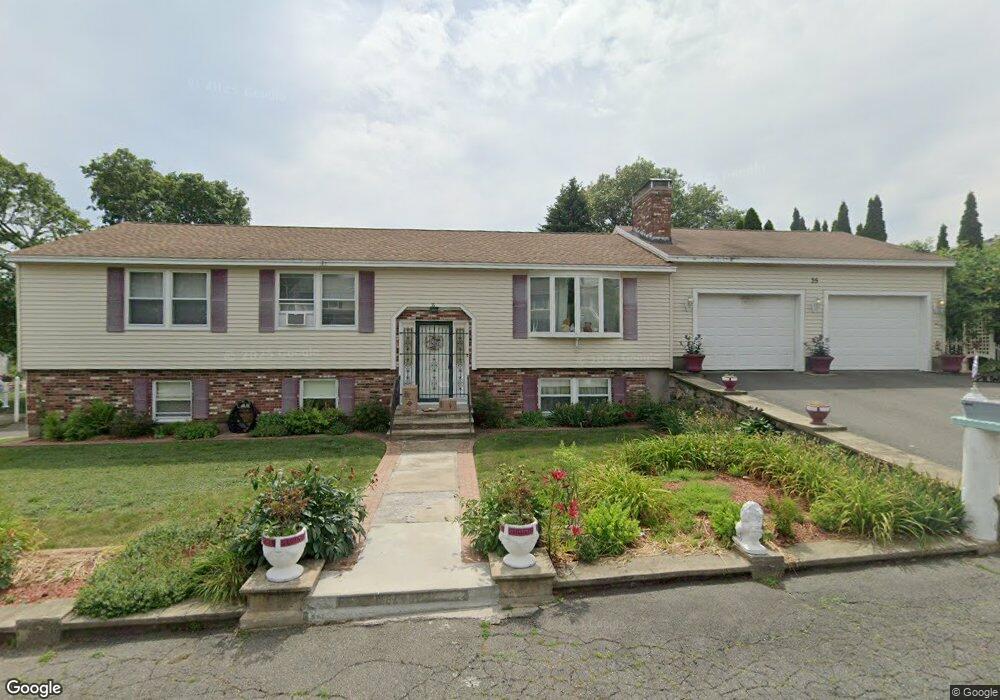
35 Crowdis St Salem, MA 01970
Witchcraft Heights NeighborhoodEstimated Value: $654,000 - $809,000
3
Beds
2
Baths
2,275
Sq Ft
$330/Sq Ft
Est. Value
About This Home
This home is located at 35 Crowdis St, Salem, MA 01970 and is currently estimated at $750,359, approximately $329 per square foot. 35 Crowdis St is a home located in Essex County with nearby schools including Horace Mann Laboratory, Witchcraft Heights Elementary School, and Saltonstall School.
Ownership History
Date
Name
Owned For
Owner Type
Purchase Details
Closed on
Jun 16, 2025
Sold by
Bakas Sonia and Ciampa Christopher
Bought by
Bakas Sonia
Current Estimated Value
Home Financials for this Owner
Home Financials are based on the most recent Mortgage that was taken out on this home.
Original Mortgage
$673,076
Outstanding Balance
$670,151
Interest Rate
6.76%
Mortgage Type
FHA
Estimated Equity
$80,208
Purchase Details
Closed on
Dec 4, 2024
Sold by
Alantzas Nicholas and Alantzas Ethel
Bought by
Bakas Sonia and Ciampa Christopher
Home Financials for this Owner
Home Financials are based on the most recent Mortgage that was taken out on this home.
Original Mortgage
$655,000
Interest Rate
6.54%
Mortgage Type
Purchase Money Mortgage
Purchase Details
Closed on
Jan 1, 1980
Bought by
Alantzas Nicholas and Alantzas Ethel
Create a Home Valuation Report for This Property
The Home Valuation Report is an in-depth analysis detailing your home's value as well as a comparison with similar homes in the area
Home Values in the Area
Average Home Value in this Area
Purchase History
| Date | Buyer | Sale Price | Title Company |
|---|---|---|---|
| Bakas Sonia | -- | None Available | |
| Bakas Sonia | $700,000 | None Available | |
| Bakas Sonia | $700,000 | None Available | |
| Alantzas Nicholas | $86,100 | -- |
Source: Public Records
Mortgage History
| Date | Status | Borrower | Loan Amount |
|---|---|---|---|
| Open | Bakas Sonia | $673,076 | |
| Previous Owner | Bakas Sonia | $655,000 | |
| Previous Owner | Alantzas Nicholas | $12,000 |
Source: Public Records
Tax History
| Year | Tax Paid | Tax Assessment Tax Assessment Total Assessment is a certain percentage of the fair market value that is determined by local assessors to be the total taxable value of land and additions on the property. | Land | Improvement |
|---|---|---|---|---|
| 2025 | $7,416 | $654,000 | $266,200 | $387,800 |
| 2024 | $7,410 | $637,700 | $251,300 | $386,400 |
| 2023 | $7,136 | $570,400 | $229,900 | $340,500 |
| 2022 | $6,820 | $514,700 | $212,100 | $302,600 |
| 2021 | $6,627 | $480,200 | $197,900 | $282,300 |
| 2020 | $6,883 | $476,300 | $194,300 | $282,000 |
| 2019 | $6,830 | $452,300 | $183,700 | $268,600 |
| 2018 | $6,544 | $425,500 | $172,200 | $253,300 |
| 2017 | $6,285 | $396,300 | $162,200 | $234,100 |
| 2016 | $6,210 | $396,300 | $162,200 | $234,100 |
| 2015 | $5,913 | $360,300 | $144,400 | $215,900 |
Source: Public Records
Map
Nearby Homes
- 4 Valley St
- 17 Gallows Hill Rd
- 7 Gables Cir
- 5 Willson Rd
- 12 Varney St
- 23 Proctor St
- 434 Essex St Unit 2R
- 20 Beacon St
- 2 Osborne St
- 128 Boston St Unit 4
- 15 Francis Rd
- 29 Willson St
- 68 Beaver St
- 16 Phelps St Unit 16-1
- 99 Mason St Unit 2
- 99 Mason St Unit 1
- 111 Mason St
- 6 Arthur St Unit 3
- 145 Federal St Unit 3
- 18 1/2 Dalton Ct Unit 18 1/2
Your Personal Tour Guide
Ask me questions while you tour the home.