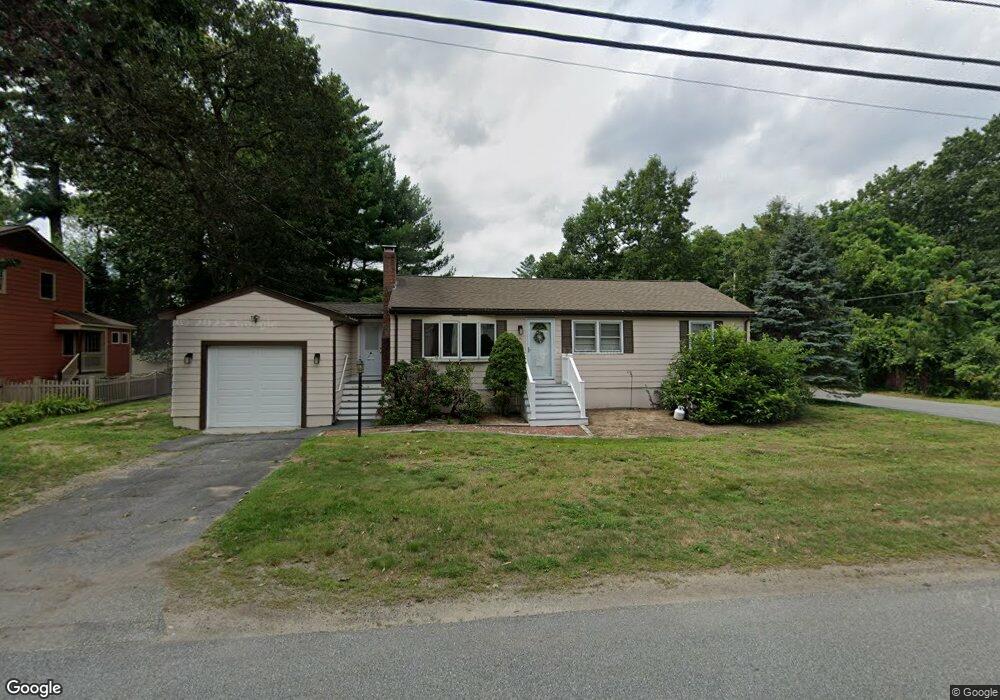
35 Cunningham St Wilmington, MA 01887
Estimated Value: $576,000 - $677,000
3
Beds
1
Bath
1,048
Sq Ft
$590/Sq Ft
Est. Value
About This Home
This home is located at 35 Cunningham St, Wilmington, MA 01887 and is currently estimated at $618,538, approximately $590 per square foot. 35 Cunningham St is a home located in Middlesex County with nearby schools including Wilmington Middle School, Wilmington High School, and Abundant Life Christian School and Childcare.
Ownership History
Date
Name
Owned For
Owner Type
Purchase Details
Closed on
Sep 17, 2024
Sold by
Allison Janet D
Bought by
Janet D Allison Lt and Allison
Current Estimated Value
Purchase Details
Closed on
Feb 16, 2011
Sold by
Mccarthy Jr Tr Francis M and Mccarthy Sean F
Bought by
Kasher Corp
Purchase Details
Closed on
Nov 12, 1974
Bought by
Allison Janet D
Create a Home Valuation Report for This Property
The Home Valuation Report is an in-depth analysis detailing your home's value as well as a comparison with similar homes in the area
Purchase History
| Date | Buyer | Sale Price | Title Company |
|---|---|---|---|
| Janet D Allison Lt | -- | None Available | |
| Janet D Allison Lt | -- | None Available | |
| Kasher Corp | -- | -- | |
| Allison Janet D | -- | -- | |
| Kasher Corp | -- | -- |
Source: Public Records
Mortgage History
| Date | Status | Borrower | Loan Amount |
|---|---|---|---|
| Previous Owner | Allison Janet D | $100,000 | |
| Previous Owner | Allison Janet D | $32,000 | |
| Previous Owner | Allison Janet D | $17,500 |
Source: Public Records
Tax History
| Year | Tax Paid | Tax Assessment Tax Assessment Total Assessment is a certain percentage of the fair market value that is determined by local assessors to be the total taxable value of land and additions on the property. | Land | Improvement |
|---|---|---|---|---|
| 2025 | $6,151 | $537,200 | $269,600 | $267,600 |
| 2024 | $5,901 | $516,300 | $269,600 | $246,700 |
| 2023 | $5,724 | $479,400 | $245,000 | $234,400 |
| 2022 | $5,441 | $417,600 | $204,200 | $213,400 |
| 2021 | $5,436 | $392,800 | $185,600 | $207,200 |
| 2020 | $5,025 | $370,000 | $185,600 | $184,400 |
| 2019 | $4,943 | $359,500 | $176,800 | $182,700 |
| 2018 | $4,588 | $318,400 | $168,400 | $150,000 |
| 2017 | $4,331 | $299,700 | $160,400 | $139,300 |
| 2016 | $4,146 | $283,400 | $152,700 | $130,700 |
| 2015 | $3,917 | $272,600 | $152,700 | $119,900 |
| 2014 | $3,640 | $255,600 | $145,400 | $110,200 |
Source: Public Records
Map
Nearby Homes
Your Personal Tour Guide
Ask me questions while you tour the home.