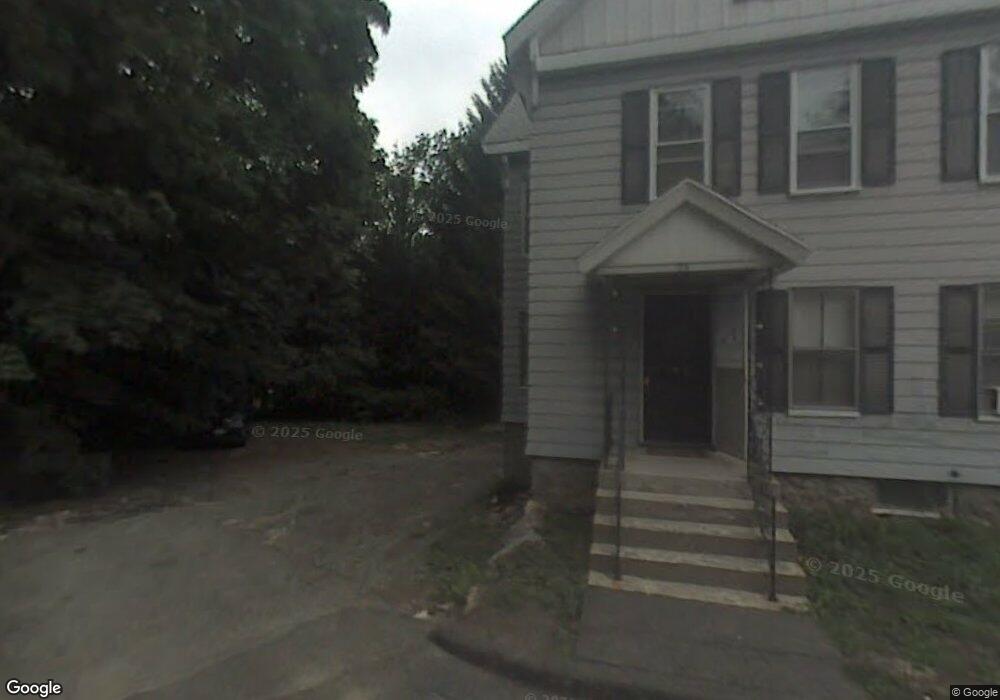
35 Davis St Marlborough, MA 01752
Estimated Value: $634,000 - $906,000
4
Beds
3
Baths
2,262
Sq Ft
$312/Sq Ft
Est. Value
About This Home
This home is located at 35 Davis St, Marlborough, MA 01752 and is currently estimated at $705,216, approximately $311 per square foot. 35 Davis St is a home located in Middlesex County with nearby schools including Marlborough High School, New Covenant Christian School, and Glenhaven Academy - JRI School.
Ownership History
Date
Name
Owned For
Owner Type
Purchase Details
Closed on
Dec 27, 2018
Sold by
Azevedo Edmilson
Bought by
Rutters Brook Llc
Current Estimated Value
Purchase Details
Closed on
Jun 10, 2005
Sold by
Fournier Paula J
Bought by
Azevedo Edmilson
Home Financials for this Owner
Home Financials are based on the most recent Mortgage that was taken out on this home.
Original Mortgage
$344,755
Interest Rate
5.79%
Mortgage Type
Purchase Money Mortgage
Create a Home Valuation Report for This Property
The Home Valuation Report is an in-depth analysis detailing your home's value as well as a comparison with similar homes in the area
Home Values in the Area
Average Home Value in this Area
Purchase History
| Date | Buyer | Sale Price | Title Company |
|---|---|---|---|
| Rutters Brook Llc | $263,000 | -- | |
| Azevedo Edmilson | $362,900 | -- |
Source: Public Records
Mortgage History
| Date | Status | Borrower | Loan Amount |
|---|---|---|---|
| Previous Owner | Azevedo Edmilson | $344,755 |
Source: Public Records
Tax History Compared to Growth
Tax History
| Year | Tax Paid | Tax Assessment Tax Assessment Total Assessment is a certain percentage of the fair market value that is determined by local assessors to be the total taxable value of land and additions on the property. | Land | Improvement |
|---|---|---|---|---|
| 2025 | $5,297 | $537,200 | $206,500 | $330,700 |
| 2024 | $5,021 | $490,300 | $187,700 | $302,600 |
| 2023 | $5,202 | $450,800 | $153,700 | $297,100 |
| 2022 | $5,088 | $387,800 | $146,400 | $241,400 |
| 2021 | $4,612 | $334,200 | $122,000 | $212,200 |
| 2020 | $4,430 | $312,400 | $116,200 | $196,200 |
| 2019 | $4,224 | $300,200 | $113,900 | $186,300 |
| 2018 | $3,753 | $256,500 | $91,700 | $164,800 |
| 2017 | $3,433 | $224,100 | $91,500 | $132,600 |
| 2016 | $3,390 | $221,000 | $91,500 | $129,500 |
| 2015 | $3,365 | $213,500 | $94,700 | $118,800 |
Source: Public Records
Map
Nearby Homes