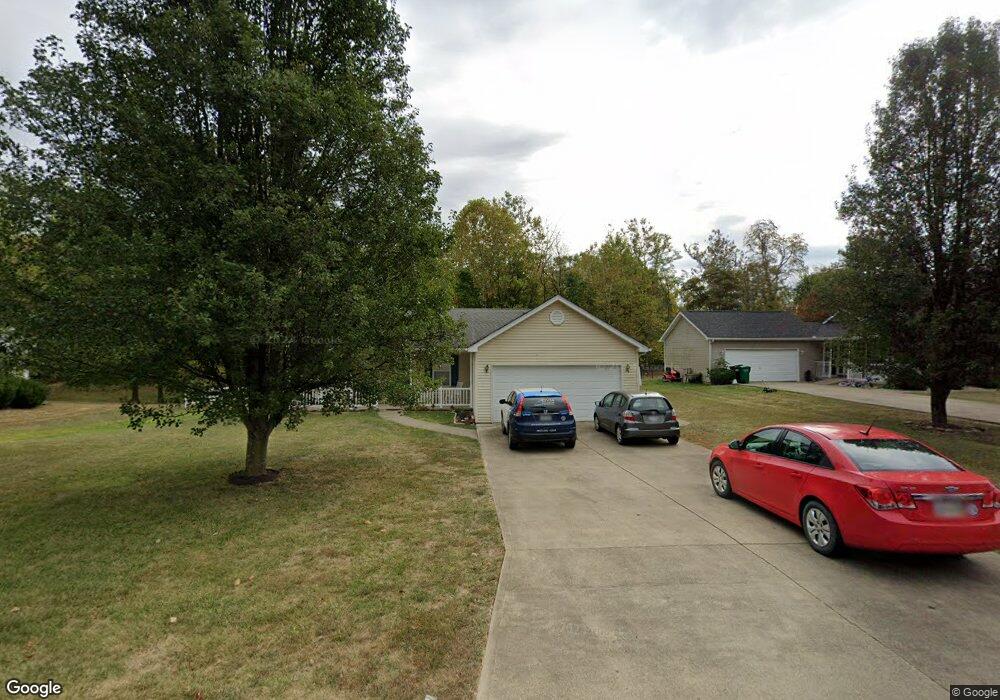
35 Douglas Ln Georgetown, OH 45121
Estimated Value: $206,000 - $240,000
3
Beds
2
Baths
1,344
Sq Ft
$168/Sq Ft
Est. Value
About This Home
This home is located at 35 Douglas Ln, Georgetown, OH 45121 and is currently estimated at $225,465, approximately $167 per square foot. 35 Douglas Ln is a home located in Brown County with nearby schools including Georgetown Elementary School and Georgetown Jr/Sr High School.
Ownership History
Date
Name
Owned For
Owner Type
Purchase Details
Closed on
Apr 9, 2021
Sold by
Mclaughlin Leslie E and Mclaughlin Edith C
Bought by
Garbutt Ronald Jon and Garbutt Allison
Current Estimated Value
Home Financials for this Owner
Home Financials are based on the most recent Mortgage that was taken out on this home.
Original Mortgage
$144,646
Outstanding Balance
$130,598
Interest Rate
3%
Mortgage Type
USDA
Estimated Equity
$94,867
Purchase Details
Closed on
Sep 23, 2004
Sold by
Cooper David and Cooper Donna
Bought by
Mclaughlin Leslie E and Mclaughlin Edith C
Purchase Details
Closed on
Jul 31, 2002
Sold by
Worthington Daryl F
Bought by
Cooper David
Purchase Details
Closed on
Jan 19, 2001
Sold by
Ptns J R
Bought by
Worthington Daryl F
Home Financials for this Owner
Home Financials are based on the most recent Mortgage that was taken out on this home.
Original Mortgage
$12,000
Interest Rate
8.12%
Mortgage Type
New Conventional
Create a Home Valuation Report for This Property
The Home Valuation Report is an in-depth analysis detailing your home's value as well as a comparison with similar homes in the area
Home Values in the Area
Average Home Value in this Area
Purchase History
| Date | Buyer | Sale Price | Title Company |
|---|---|---|---|
| Garbutt Ronald Jon | $143,200 | Ivy Pointe Title Llc | |
| Garbutt Ronald Jon | -- | None Listed On Document | |
| Mclaughlin Leslie E | $105,900 | -- | |
| Cooper David | $16,000 | -- | |
| Worthington Daryl F | $13,750 | -- |
Source: Public Records
Mortgage History
| Date | Status | Borrower | Loan Amount |
|---|---|---|---|
| Open | Garbutt Ronald Jon | $144,646 | |
| Closed | Garbutt Ronald Jon | $144,646 | |
| Previous Owner | Worthington Daryl F | $12,000 |
Source: Public Records
Tax History Compared to Growth
Tax History
| Year | Tax Paid | Tax Assessment Tax Assessment Total Assessment is a certain percentage of the fair market value that is determined by local assessors to be the total taxable value of land and additions on the property. | Land | Improvement |
|---|---|---|---|---|
| 2024 | $2,190 | $60,390 | $9,710 | $50,680 |
| 2023 | $2,190 | $47,820 | $8,400 | $39,420 |
| 2022 | $1,886 | $47,820 | $8,400 | $39,420 |
| 2021 | $1,493 | $47,820 | $8,400 | $39,420 |
| 2020 | $1,262 | $39,850 | $7,000 | $32,850 |
| 2019 | $629 | $39,850 | $7,000 | $32,850 |
| 2018 | $1,244 | $39,850 | $7,000 | $32,850 |
| 2017 | $926 | $36,240 | $7,700 | $28,540 |
| 2016 | $926 | $36,240 | $7,700 | $28,540 |
| 2015 | $938 | $36,240 | $7,700 | $28,540 |
| 2014 | $953 | $35,540 | $7,000 | $28,540 |
| 2013 | $950 | $35,540 | $7,000 | $28,540 |
Source: Public Records
Map
Nearby Homes
- 25 Douglas Ln
- 0 Douglas Ln Unit 1641744
- 175 Douglas Cir
- 418 Home St
- 708 E State St
- 666 E State St
- 155 Free Soil Rd
- 20 Lakeview Acres Dr
- 27 Marilyn Dr
- 505 S Water St
- 104 Elm St
- 406 E North St
- 59 Williams Dr
- 402 S Pleasant St
- 60 New St
- 20 Heritage Hill Dr
- 306 W 2nd St
- 403 Elmwood Ct
- 401 Elmwood Ct
- 470 Free Soil Rd