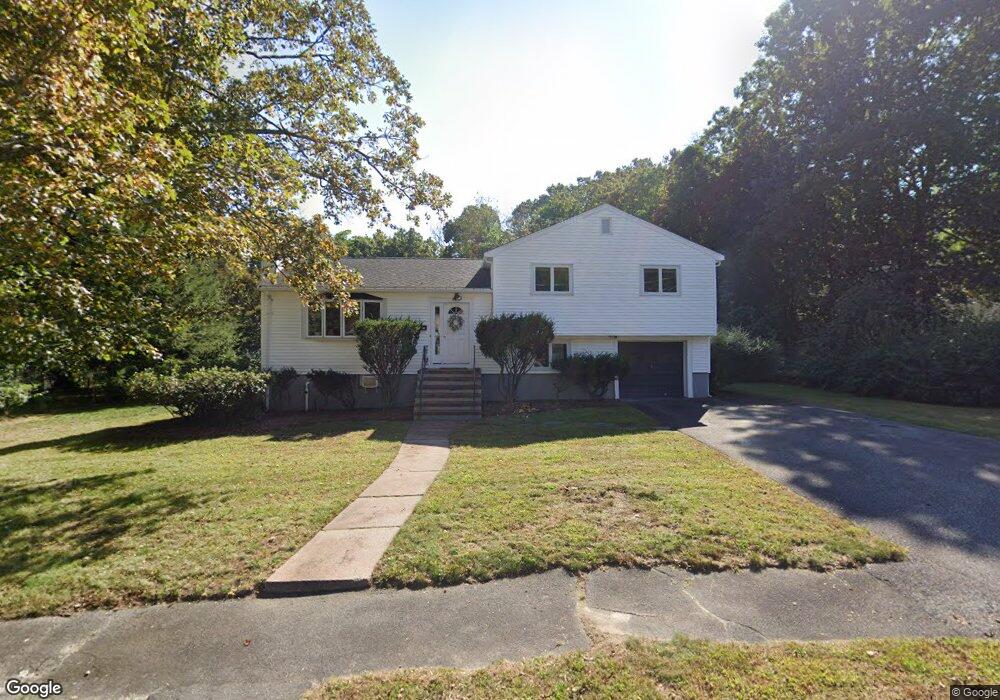
35 Dunedin Rd Unit 1 Wellesley Hills, MA 02481
Wellesley Hills NeighborhoodEstimated Value: $1,214,000 - $1,323,000
3
Beds
2
Baths
2,000
Sq Ft
$641/Sq Ft
Est. Value
About This Home
This home is located at 35 Dunedin Rd Unit 1, Wellesley Hills, MA 02481 and is currently estimated at $1,282,916, approximately $641 per square foot. 35 Dunedin Rd Unit 1 is a home located in Norfolk County with nearby schools including Joseph E. Fiske Elementary School, Wellesley Middle School, and Wellesley Sr High School.
Ownership History
Date
Name
Owned For
Owner Type
Purchase Details
Closed on
Jan 11, 2000
Sold by
Dinno Saad R and Dinno Reem A
Bought by
Dinno Ft 3
Current Estimated Value
Purchase Details
Closed on
Jun 30, 1995
Sold by
Matsuoka Grove T and Matsuoka Patricia L
Bought by
Dinno Saad R and Dinno Reem A
Home Financials for this Owner
Home Financials are based on the most recent Mortgage that was taken out on this home.
Original Mortgage
$210,000
Interest Rate
7.8%
Mortgage Type
Purchase Money Mortgage
Purchase Details
Closed on
Feb 12, 1993
Sold by
Hanauer Extr Melsin V
Bought by
Matsuoka Grove T and Matsuoka Patricia L
Home Financials for this Owner
Home Financials are based on the most recent Mortgage that was taken out on this home.
Original Mortgage
$186,300
Interest Rate
8.13%
Mortgage Type
Purchase Money Mortgage
Create a Home Valuation Report for This Property
The Home Valuation Report is an in-depth analysis detailing your home's value as well as a comparison with similar homes in the area
Home Values in the Area
Average Home Value in this Area
Purchase History
| Date | Buyer | Sale Price | Title Company |
|---|---|---|---|
| Dinno Ft 3 | $420,000 | -- | |
| Dinno Saad R | $265,000 | -- | |
| Matsuoka Grove T | $207,000 | -- |
Source: Public Records
Mortgage History
| Date | Status | Borrower | Loan Amount |
|---|---|---|---|
| Open | Matsuoka Grove T | $158,518 | |
| Previous Owner | Matsuoka Grove T | $210,000 | |
| Previous Owner | Matsuoka Grove T | $186,300 |
Source: Public Records
Tax History Compared to Growth
Tax History
| Year | Tax Paid | Tax Assessment Tax Assessment Total Assessment is a certain percentage of the fair market value that is determined by local assessors to be the total taxable value of land and additions on the property. | Land | Improvement |
|---|---|---|---|---|
| 2025 | $12,161 | $1,183,000 | $1,071,000 | $112,000 |
| 2024 | $12,284 | $1,180,000 | $1,071,000 | $109,000 |
| 2023 | $12,996 | $1,135,000 | $1,038,000 | $97,000 |
| 2022 | $10,921 | $935,000 | $797,000 | $138,000 |
| 2021 | $10,469 | $891,000 | $753,000 | $138,000 |
| 2020 | $10,300 | $891,000 | $753,000 | $138,000 |
| 2019 | $9,800 | $847,000 | $709,000 | $138,000 |
| 2018 | $7,768 | $650,000 | $564,000 | $86,000 |
| 2017 | $7,593 | $644,000 | $564,000 | $80,000 |
| 2016 | $7,477 | $632,000 | $554,000 | $78,000 |
| 2015 | $7,329 | $634,000 | $555,000 | $79,000 |
Source: Public Records
Map
Nearby Homes
- 10 Fife Rd
- 206 Cedar St
- 18 Evergreen Rd
- 345 Central Ave
- 310 Oakland St
- 78 Hunnewell St
- 181 Saint Mary St
- 187 Saint Mary St
- 130 Central Ave
- 443 Central Ave
- 41 Lee Rd
- 98 Hunnewell St
- 27 Hamilton Place
- 12 Hill St
- 62 Evelyn Rd
- 45 River Ave Unit 45
- 1003 Chestnut St
- 992 Chestnut St
- 35 Andrea Cir
- 7 Avery St