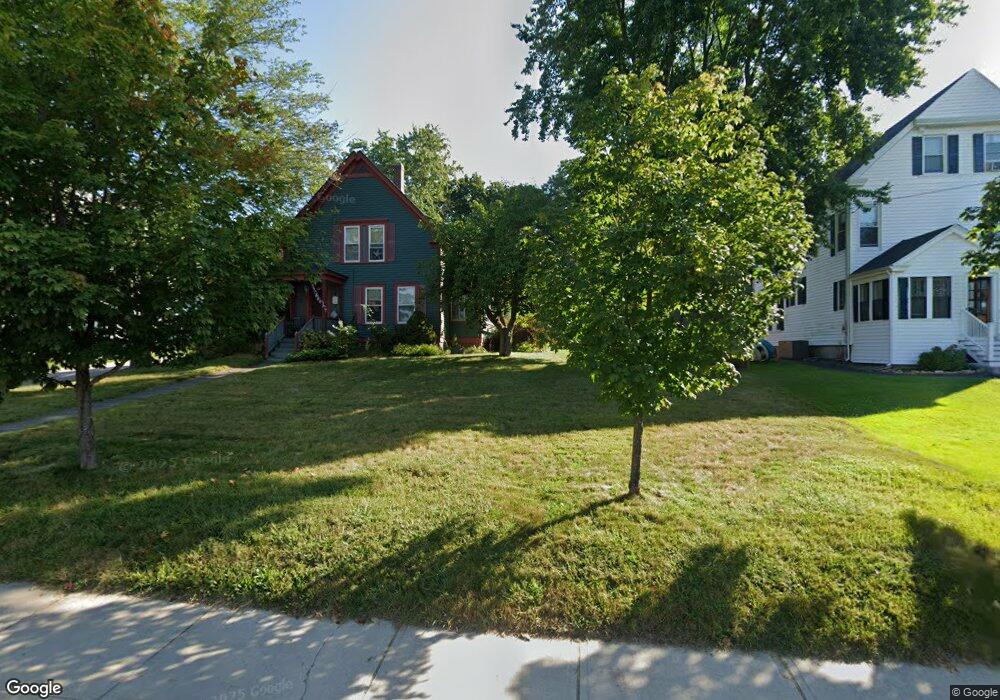
35 Dutcher St Hopedale, MA 01747
Estimated Value: $454,000 - $544,000
3
Beds
2
Baths
1,649
Sq Ft
$299/Sq Ft
Est. Value
About This Home
This home is located at 35 Dutcher St, Hopedale, MA 01747 and is currently estimated at $492,842, approximately $298 per square foot. 35 Dutcher St is a home located in Worcester County with nearby schools including Memorial Elementary School and Hopedale Jr Sr High School.
Ownership History
Date
Name
Owned For
Owner Type
Purchase Details
Closed on
Dec 19, 1995
Sold by
Travers D Craig
Bought by
Travers Amy M
Current Estimated Value
Home Financials for this Owner
Home Financials are based on the most recent Mortgage that was taken out on this home.
Original Mortgage
$95,000
Interest Rate
7.43%
Mortgage Type
Purchase Money Mortgage
Create a Home Valuation Report for This Property
The Home Valuation Report is an in-depth analysis detailing your home's value as well as a comparison with similar homes in the area
Home Values in the Area
Average Home Value in this Area
Purchase History
| Date | Buyer | Sale Price | Title Company |
|---|---|---|---|
| Travers Amy M | $102,430 | -- |
Source: Public Records
Mortgage History
| Date | Status | Borrower | Loan Amount |
|---|---|---|---|
| Open | Travers Amy M | $175,000 | |
| Closed | Travers Amy M | $120,000 | |
| Closed | Travers Amy M | $12,000 | |
| Closed | Travers Amy M | $95,000 |
Source: Public Records
Tax History Compared to Growth
Tax History
| Year | Tax Paid | Tax Assessment Tax Assessment Total Assessment is a certain percentage of the fair market value that is determined by local assessors to be the total taxable value of land and additions on the property. | Land | Improvement |
|---|---|---|---|---|
| 2025 | $6,453 | $388,500 | $159,000 | $229,500 |
| 2024 | $6,044 | $364,100 | $151,500 | $212,600 |
| 2023 | $5,475 | $339,000 | $149,000 | $190,000 |
| 2022 | $5,369 | $313,800 | $136,600 | $177,200 |
| 2021 | $2,008 | $285,800 | $124,100 | $161,700 |
| 2020 | $4,925 | $282,900 | $124,100 | $158,800 |
| 2019 | $1,739 | $262,100 | $118,700 | $143,400 |
| 2018 | $1,656 | $251,600 | $113,300 | $138,300 |
| 2017 | $2,901 | $235,900 | $107,200 | $128,700 |
| 2016 | $3,926 | $233,300 | $107,200 | $126,100 |
| 2015 | $3,785 | $228,300 | $107,200 | $121,100 |
Source: Public Records
Map
Nearby Homes
- 33 Dutcher St
- 39 Dutcher St Unit 10
- 39 Prospect St
- 37 Dutcher St Unit 5
- 37 Dutcher St Unit 3
- 37 Dutcher St Unit 2
- 37 Dutcher St Unit 41
- 41 Dutcher St
- 37 Prospect St
- 37 Prospect St Unit 37
- 35 Prospect St
- 34 Dutcher St Unit 36
- 33 Prospect St
- 16 Union St
- 12 Union St Unit 14
- 31 Prospect St
- 31 Prospect St Unit 1
- 18 Union St
- 12 -14 Union St Unit 1
- 79 Social St