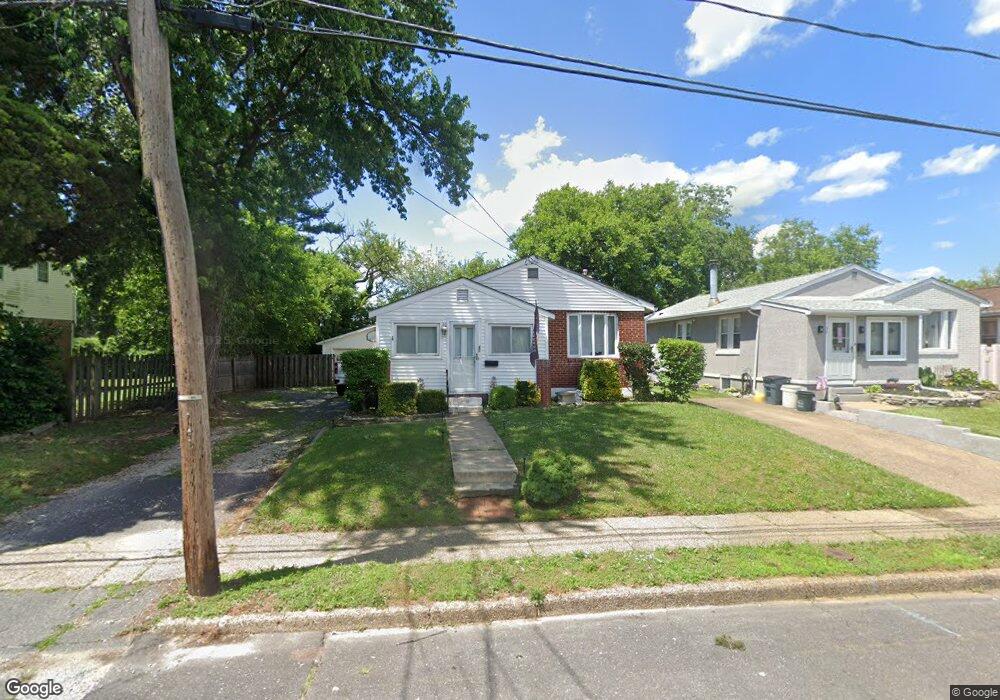
35 E 8th Ave Runnemede, NJ 08078
Estimated Value: $247,000 - $274,451
3
Beds
1
Bath
912
Sq Ft
$284/Sq Ft
Est. Value
About This Home
This home is located at 35 E 8th Ave, Runnemede, NJ 08078 and is currently estimated at $258,613, approximately $283 per square foot. 35 E 8th Ave is a home located in Camden County with nearby schools including Mary E. Volz Elementary School, Downing Elementary School, and Triton High School.
Ownership History
Date
Name
Owned For
Owner Type
Purchase Details
Closed on
Mar 20, 2008
Sold by
Mcintosh James and Clauser Karen M
Bought by
Gailer Mark J and Gailer Victoria R
Current Estimated Value
Home Financials for this Owner
Home Financials are based on the most recent Mortgage that was taken out on this home.
Original Mortgage
$130,898
Outstanding Balance
$82,938
Interest Rate
6.06%
Mortgage Type
FHA
Estimated Equity
$175,675
Purchase Details
Closed on
Jul 31, 2001
Sold by
Marks Thomas W
Bought by
Mcintosh James and Clauser Karen M
Home Financials for this Owner
Home Financials are based on the most recent Mortgage that was taken out on this home.
Original Mortgage
$68,005
Interest Rate
7.06%
Mortgage Type
FHA
Create a Home Valuation Report for This Property
The Home Valuation Report is an in-depth analysis detailing your home's value as well as a comparison with similar homes in the area
Home Values in the Area
Average Home Value in this Area
Purchase History
| Date | Buyer | Sale Price | Title Company |
|---|---|---|---|
| Gailer Mark J | $136,000 | -- | |
| Mcintosh James | $85,000 | -- |
Source: Public Records
Mortgage History
| Date | Status | Borrower | Loan Amount |
|---|---|---|---|
| Open | Gailer Mark J | $130,898 | |
| Previous Owner | Mcintosh James | $68,005 |
Source: Public Records
Tax History
| Year | Tax Paid | Tax Assessment Tax Assessment Total Assessment is a certain percentage of the fair market value that is determined by local assessors to be the total taxable value of land and additions on the property. | Land | Improvement |
|---|---|---|---|---|
| 2025 | $5,493 | $121,900 | $46,400 | $75,500 |
| 2024 | $5,326 | $121,900 | $46,400 | $75,500 |
| 2023 | $5,326 | $121,900 | $46,400 | $75,500 |
| 2022 | $5,156 | $121,900 | $46,400 | $75,500 |
| 2021 | $5,034 | $121,900 | $46,400 | $75,500 |
| 2020 | $4,984 | $121,900 | $46,400 | $75,500 |
| 2019 | $4,893 | $121,900 | $46,400 | $75,500 |
| 2018 | $4,799 | $121,900 | $46,400 | $75,500 |
| 2017 | $4,676 | $121,900 | $46,400 | $75,500 |
| 2016 | $4,618 | $121,900 | $46,400 | $75,500 |
| 2015 | $4,631 | $121,900 | $46,400 | $75,500 |
| 2014 | $4,571 | $121,900 | $46,400 | $75,500 |
Source: Public Records
Map
Nearby Homes
- 23 E 10th Ave
- 232 Garden Terrace
- 1042 Central Ave
- 38 Robert Dr
- 29 W 4th Ave
- 206 W 5th Ave
- 319 Bowers Ave
- 39 E 2nd Ave
- 308 Smith Ln
- 850 Orchard Ave
- 408 W 3rd Ave
- 60 N Oakland Ave
- 534 Blanchard Ave
- 141 Oak Ave
- 15 Sullivan Ave
- 309 Oakland Ave
- 94 E Browning Rd
- 524 Hirsch Ave
- 37 S Read Ave
- 411 Center Ave
Your Personal Tour Guide
Ask me questions while you tour the home.