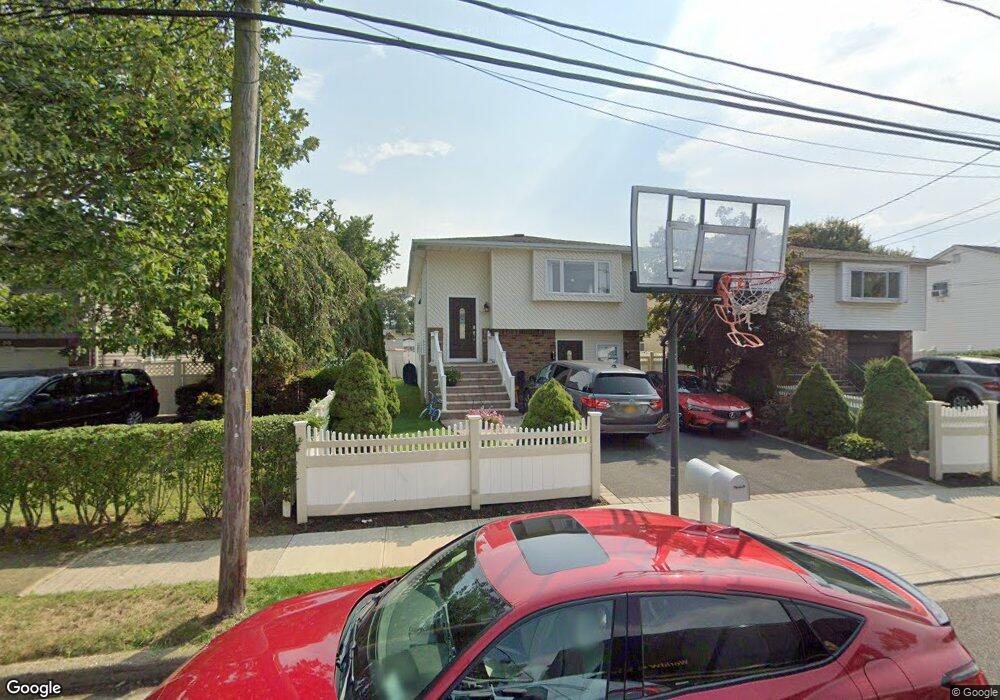
35 E Grove St Massapequa, NY 11758
Estimated Value: $602,983 - $659,000
--
Bed
2
Baths
1,044
Sq Ft
$604/Sq Ft
Est. Value
About This Home
This home is located at 35 E Grove St, Massapequa, NY 11758 and is currently estimated at $630,992, approximately $604 per square foot. 35 E Grove St is a home located in Nassau County with nearby schools including Northeast Elementary School, Park Avenue Memorial Elementary School, and Northwest Elementary School.
Ownership History
Date
Name
Owned For
Owner Type
Purchase Details
Closed on
Aug 30, 2013
Sold by
Ramos Jose N and Reyes Jose A
Bought by
Peralta Israel B and Ramos Jose N
Current Estimated Value
Purchase Details
Closed on
Nov 18, 2011
Sold by
Pastora Jose and Pastora Maria
Bought by
Ramos Jose N and Reyes Jose A
Home Financials for this Owner
Home Financials are based on the most recent Mortgage that was taken out on this home.
Original Mortgage
$282,648
Interest Rate
3.75%
Mortgage Type
FHA
Purchase Details
Closed on
Jul 16, 2004
Sold by
Florestan Jocelyn
Bought by
Paulino Ramona
Create a Home Valuation Report for This Property
The Home Valuation Report is an in-depth analysis detailing your home's value as well as a comparison with similar homes in the area
Home Values in the Area
Average Home Value in this Area
Purchase History
| Date | Buyer | Sale Price | Title Company |
|---|---|---|---|
| Peralta Israel B | -- | -- | |
| Ramos Jose N | $290,000 | -- | |
| Paulino Ramona | $272,900 | -- |
Source: Public Records
Mortgage History
| Date | Status | Borrower | Loan Amount |
|---|---|---|---|
| Previous Owner | Ramos Jose N | $282,648 |
Source: Public Records
Tax History Compared to Growth
Tax History
| Year | Tax Paid | Tax Assessment Tax Assessment Total Assessment is a certain percentage of the fair market value that is determined by local assessors to be the total taxable value of land and additions on the property. | Land | Improvement |
|---|---|---|---|---|
| 2025 | $10,245 | $323 | $102 | $221 |
| 2024 | $2,870 | $323 | $102 | $221 |
| 2023 | $9,248 | $323 | $102 | $221 |
| 2022 | $9,248 | $323 | $102 | $221 |
| 2021 | $10,443 | $313 | $99 | $214 |
| 2020 | $10,767 | $706 | $426 | $280 |
| 2019 | $12,555 | $706 | $426 | $280 |
| 2018 | $11,999 | $706 | $0 | $0 |
| 2017 | $6,595 | $706 | $426 | $280 |
| 2016 | $9,934 | $706 | $426 | $280 |
| 2015 | $2,993 | $706 | $426 | $280 |
| 2014 | $2,993 | $706 | $426 | $280 |
| 2013 | $2,717 | $706 | $426 | $280 |
Source: Public Records
Map
Nearby Homes
- 95 Colonial Dr
- 67 Colonial Dr
- 20 Quail Run
- 45 Carman Mill Rd
- 0 Clocks Blvd
- 200 Lot B Clocks Blvd
- 7 Cottage Place
- 45 County Line Rd
- 15 Major Rd
- 21 Oakley Ave
- 49 S Baldwin Place
- 124 Ketcham Ave
- 91 Ireland Place
- 304 Unqua Rd
- 38 Park Ave
- 50 Burch Ave
- 121 Park Ave Unit C4
- 21 Westgate Rd
- 108 Block Blvd
- 42 Westgate Rd