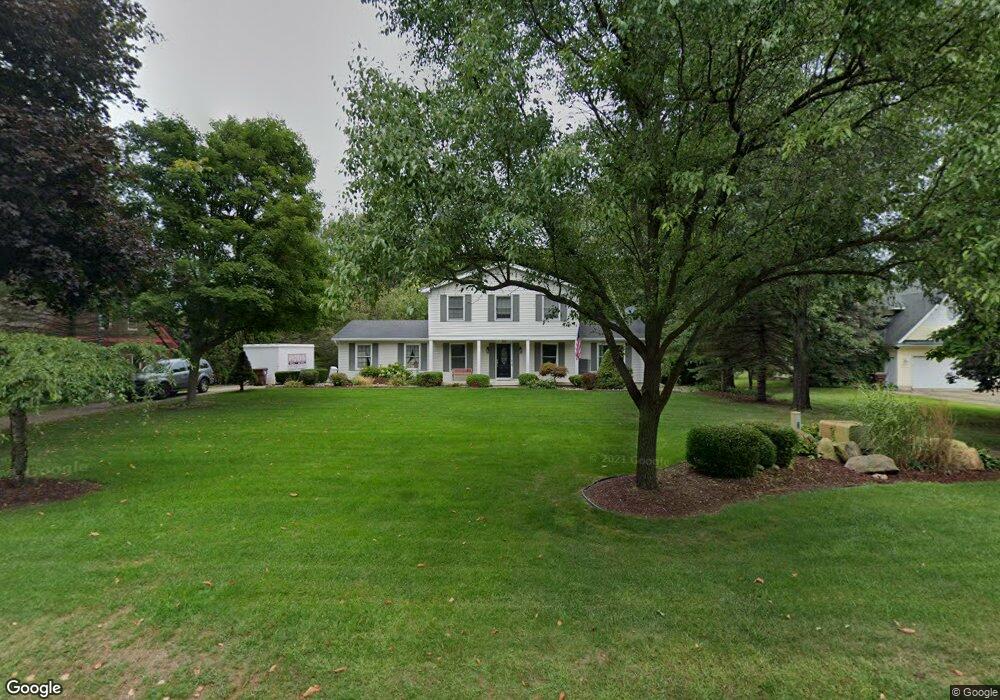
35 E Newman Rd Williamston, MI 48895
Estimated Value: $410,000 - $536,000
3
Beds
3
Baths
812
Sq Ft
$546/Sq Ft
Est. Value
About This Home
This home is located at 35 E Newman Rd, Williamston, MI 48895 and is currently estimated at $443,132, approximately $545 per square foot. 35 E Newman Rd is a home located in Ingham County with nearby schools including Haslett High School and St. Martha School.
Ownership History
Date
Name
Owned For
Owner Type
Purchase Details
Closed on
Nov 2, 2021
Sold by
Duke Melissa
Bought by
Bussa Amanda C and Bussa Brandon L
Current Estimated Value
Home Financials for this Owner
Home Financials are based on the most recent Mortgage that was taken out on this home.
Original Mortgage
$280,000
Outstanding Balance
$256,177
Interest Rate
2.88%
Mortgage Type
New Conventional
Estimated Equity
$186,955
Purchase Details
Closed on
Jun 4, 2010
Sold by
Eggemeyer Steven N and Eggemeyer Jean H B
Bought by
Duke Melissa
Home Financials for this Owner
Home Financials are based on the most recent Mortgage that was taken out on this home.
Original Mortgage
$212,143
Interest Rate
5.13%
Mortgage Type
FHA
Purchase Details
Closed on
Jul 23, 1997
Sold by
Latta William and Latta Mary
Bought by
Eggemeyer Steven N and Eggemeyer Jean H
Purchase Details
Closed on
Aug 1, 1989
Create a Home Valuation Report for This Property
The Home Valuation Report is an in-depth analysis detailing your home's value as well as a comparison with similar homes in the area
Home Values in the Area
Average Home Value in this Area
Purchase History
| Date | Buyer | Sale Price | Title Company |
|---|---|---|---|
| Bussa Amanda C | $350,000 | None Available | |
| Duke Melissa | $215,000 | Tri County Title Agency Llc | |
| Eggemeyer Steven N | $176,000 | -- | |
| -- | $134,500 | -- |
Source: Public Records
Mortgage History
| Date | Status | Borrower | Loan Amount |
|---|---|---|---|
| Open | Bussa Amanda C | $280,000 | |
| Previous Owner | Duke Melissa | $212,143 |
Source: Public Records
Tax History
| Year | Tax Paid | Tax Assessment Tax Assessment Total Assessment is a certain percentage of the fair market value that is determined by local assessors to be the total taxable value of land and additions on the property. | Land | Improvement |
|---|---|---|---|---|
| 2025 | $7,513 | $193,500 | $24,800 | $168,700 |
| 2024 | $22 | $193,500 | $24,800 | $168,700 |
| 2023 | $6,981 | $178,500 | $22,400 | $156,100 |
| 2022 | $6,653 | $157,100 | $21,000 | $136,100 |
| 2021 | $4,726 | $145,900 | $19,000 | $126,900 |
| 2020 | $4,553 | $141,600 | $19,000 | $122,600 |
| 2019 | $4,112 | $136,600 | $17,500 | $119,100 |
| 2018 | $4,312 | $116,200 | $17,200 | $99,000 |
| 2017 | $4,037 | $116,200 | $17,200 | $99,000 |
| 2016 | $4,000 | $112,700 | $15,000 | $97,700 |
| 2015 | -- | $107,100 | $30,000 | $77,100 |
| 2014 | -- | $104,000 | $30,000 | $74,000 |
Source: Public Records
Map
Nearby Homes
- 161 Germany Rd
- 160 W Sherwood Rd
- 4400 Selwood Ct
- 0 van Atta Rd
- 4552 van Atta Rd
- 575 Piper Rd
- 725 W Grand River Ave
- 5384 van Atta Rd
- 5396 van Atta Rd
- 5560 Strawberry Ln
- 5614 Copper Creek Dr
- 4330 Cornell Rd
- 1171 Teakwood Cir
- 1488 Silverstone Way
- 5187 Twinging Dr
- 1555 W Pond Dr Unit 33
- 1555 W Pond Dr Unit 23
- 4448 Greenwood Dr
- 1563 W Pond Dr Unit 15
- 1571 W Pond Dr Unit 14
- 23 E Newman Rd
- 47 E Newman Rd
- 4900 Meridian Rd
- 11 E Newman Rd
- 32 E Newman Rd
- 59 E Newman Rd
- 44 E Newman Rd
- 4910 Meridian Rd
- 22 E Newman Rd
- 56 E Newman Rd
- 0 Newman Rd
- 4864 Meridian Rd
- 68 E Newman Rd
- 71 E Newman Rd
- 80 E Newman Rd
- 4850 Meridian Rd
- 83 E Newman Rd
- 4930 Meridian Rd
- 22 Newman Rd
- 92 E Newman Rd
Your Personal Tour Guide
Ask me questions while you tour the home.