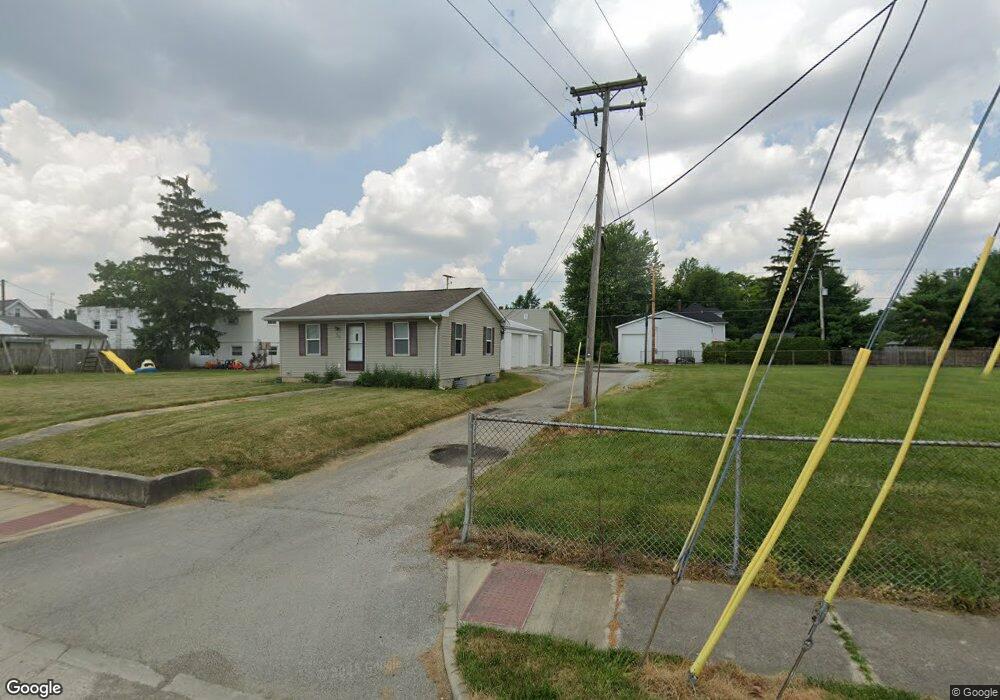
35 Elm Ave Tiffin, OH 44883
Estimated Value: $99,000 - $153,000
3
Beds
1
Bath
672
Sq Ft
$189/Sq Ft
Est. Value
About This Home
This home is located at 35 Elm Ave, Tiffin, OH 44883 and is currently estimated at $126,938, approximately $188 per square foot. 35 Elm Ave is a home with nearby schools including Columbian High School, Calvert High School, and Calvert Catholic Elementary School.
Ownership History
Date
Name
Owned For
Owner Type
Purchase Details
Closed on
May 24, 2010
Sold by
Brown Steve E and Franklin Daniel S
Bought by
After Hours Enterprise Ltd
Current Estimated Value
Purchase Details
Closed on
Aug 21, 2006
Sold by
Household Realty Corp
Bought by
Brown Steven and Franklin Dan
Home Financials for this Owner
Home Financials are based on the most recent Mortgage that was taken out on this home.
Original Mortgage
$40,500
Interest Rate
6.7%
Mortgage Type
Purchase Money Mortgage
Purchase Details
Closed on
Mar 30, 1995
Sold by
Bowman Edward J
Bought by
Bowman Edward J
Purchase Details
Closed on
Mar 1, 1987
Create a Home Valuation Report for This Property
The Home Valuation Report is an in-depth analysis detailing your home's value as well as a comparison with similar homes in the area
Home Values in the Area
Average Home Value in this Area
Purchase History
| Date | Buyer | Sale Price | Title Company |
|---|---|---|---|
| After Hours Enterprise Ltd | -- | None Available | |
| Brown Steven | $45,000 | None Available | |
| Bowman Edward J | -- | -- | |
| -- | $35,000 | -- |
Source: Public Records
Mortgage History
| Date | Status | Borrower | Loan Amount |
|---|---|---|---|
| Previous Owner | Brown Steven | $40,500 |
Source: Public Records
Tax History Compared to Growth
Tax History
| Year | Tax Paid | Tax Assessment Tax Assessment Total Assessment is a certain percentage of the fair market value that is determined by local assessors to be the total taxable value of land and additions on the property. | Land | Improvement |
|---|---|---|---|---|
| 2024 | $1,219 | $35,250 | $9,660 | $25,590 |
| 2023 | $1,220 | $35,250 | $9,660 | $25,590 |
| 2022 | $1,174 | $28,150 | $7,880 | $20,270 |
| 2021 | $1,183 | $28,150 | $7,880 | $20,270 |
| 2020 | $1,205 | $28,154 | $7,882 | $20,272 |
| 2019 | $1,222 | $27,605 | $7,728 | $19,877 |
| 2018 | $1,224 | $27,605 | $7,728 | $19,877 |
| 2017 | $1,201 | $27,605 | $7,728 | $19,877 |
| 2016 | $1,177 | $26,873 | $7,497 | $19,376 |
| 2015 | $1,164 | $26,873 | $7,497 | $19,376 |
| 2014 | $1,098 | $26,873 | $7,497 | $19,376 |
| 2013 | $1,174 | $27,703 | $7,728 | $19,975 |
Source: Public Records
Map
Nearby Homes