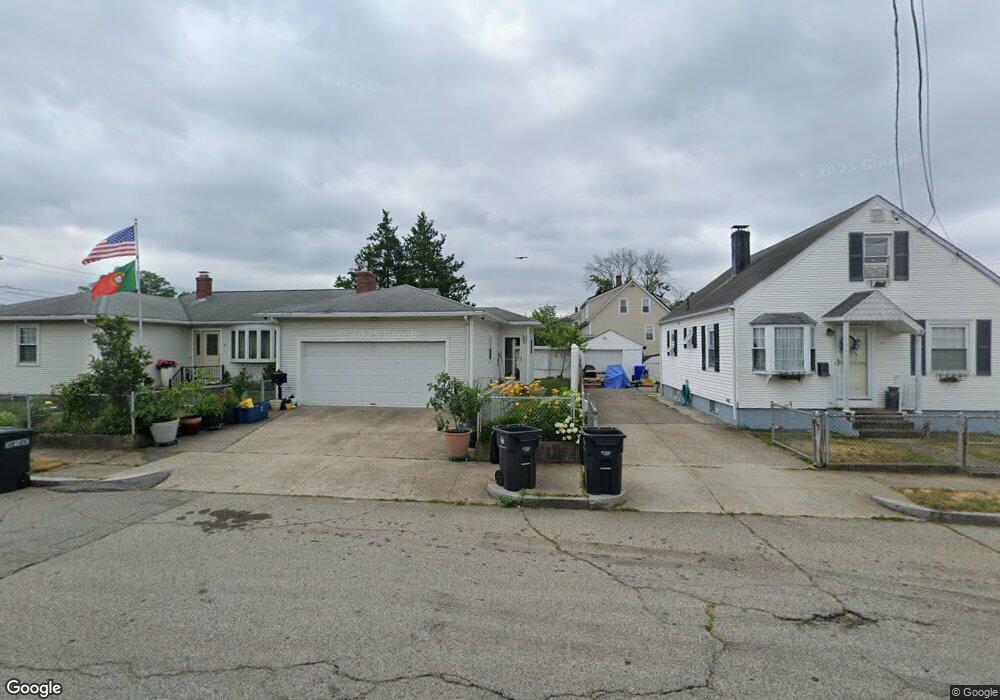
35 Exeter Ave Pawtucket, RI 02860
Beverage Hill-The Plains NeighborhoodEstimated Value: $362,000 - $427,000
3
Beds
1
Bath
1,730
Sq Ft
$222/Sq Ft
Est. Value
About This Home
This home is located at 35 Exeter Ave, Pawtucket, RI 02860 and is currently estimated at $383,232, approximately $221 per square foot. 35 Exeter Ave is a home located in Providence County with nearby schools including International Charter School, Blackstone Academy Charter School, and Saint Teresa Catholic Elementary School.
Ownership History
Date
Name
Owned For
Owner Type
Purchase Details
Closed on
Aug 28, 2003
Sold by
Daniels Rita
Bought by
Martin Nicholas J and Martin Rebecca C
Current Estimated Value
Home Financials for this Owner
Home Financials are based on the most recent Mortgage that was taken out on this home.
Original Mortgage
$172,600
Outstanding Balance
$75,755
Interest Rate
5.69%
Estimated Equity
$307,477
Purchase Details
Closed on
May 30, 2001
Sold by
Beaucage Thomas and Beaucage Deborah A
Bought by
Daniels Rita
Home Financials for this Owner
Home Financials are based on the most recent Mortgage that was taken out on this home.
Original Mortgage
$124,388
Interest Rate
7.09%
Purchase Details
Closed on
Feb 16, 1993
Sold by
Campos Mary
Bought by
Beaucage Thomas and Beaucage Deborah
Home Financials for this Owner
Home Financials are based on the most recent Mortgage that was taken out on this home.
Original Mortgage
$80,803
Interest Rate
8.13%
Create a Home Valuation Report for This Property
The Home Valuation Report is an in-depth analysis detailing your home's value as well as a comparison with similar homes in the area
Home Values in the Area
Average Home Value in this Area
Purchase History
| Date | Buyer | Sale Price | Title Company |
|---|---|---|---|
| Martin Nicholas J | $176,000 | -- | |
| Daniels Rita | $129,000 | -- | |
| Beaucage Thomas | $80,000 | -- |
Source: Public Records
Mortgage History
| Date | Status | Borrower | Loan Amount |
|---|---|---|---|
| Open | Beaucage Thomas | $172,600 | |
| Previous Owner | Beaucage Thomas | $124,388 | |
| Previous Owner | Beaucage Thomas | $80,803 |
Source: Public Records
Tax History Compared to Growth
Tax History
| Year | Tax Paid | Tax Assessment Tax Assessment Total Assessment is a certain percentage of the fair market value that is determined by local assessors to be the total taxable value of land and additions on the property. | Land | Improvement |
|---|---|---|---|---|
| 2025 | $3,414 | $259,600 | $102,400 | $157,200 |
| 2024 | $3,203 | $259,600 | $102,400 | $157,200 |
| 2023 | $3,728 | $220,100 | $85,700 | $134,400 |
| 2022 | $3,649 | $220,100 | $85,700 | $134,400 |
| 2021 | $3,649 | $220,100 | $85,700 | $134,400 |
| 2020 | $3,355 | $160,600 | $59,400 | $101,200 |
| 2019 | $3,355 | $160,600 | $59,400 | $101,200 |
| 2018 | $3,233 | $160,600 | $59,400 | $101,200 |
| 2017 | $3,397 | $149,500 | $45,000 | $104,500 |
| 2016 | $3,273 | $149,500 | $45,000 | $104,500 |
| 2015 | $3,273 | $149,500 | $45,000 | $104,500 |
| 2014 | $3,185 | $138,100 | $45,000 | $93,100 |
Source: Public Records
Map
Nearby Homes
- 45 Exeter Ave
- 21 Exeter Ave
- 48 Fenwood Ave
- 52 Fenwood Ave
- 42 Fenwood Ave
- 357 Prospect St
- 30 Fenwood Ave
- 35 Fenwood Ave
- 350 Prospect St
- 49 Fenwood Ave
- 43 Fenwood Ave
- 29 Fenwood Ave
- 371 Prospect St
- 11 Dunnell Ln
- 340 Prospect St
- 360 Prospect St
- 336 Prospect St
- 334 Prospect St
- 381 Prospect St
- 66 Exeter Ave