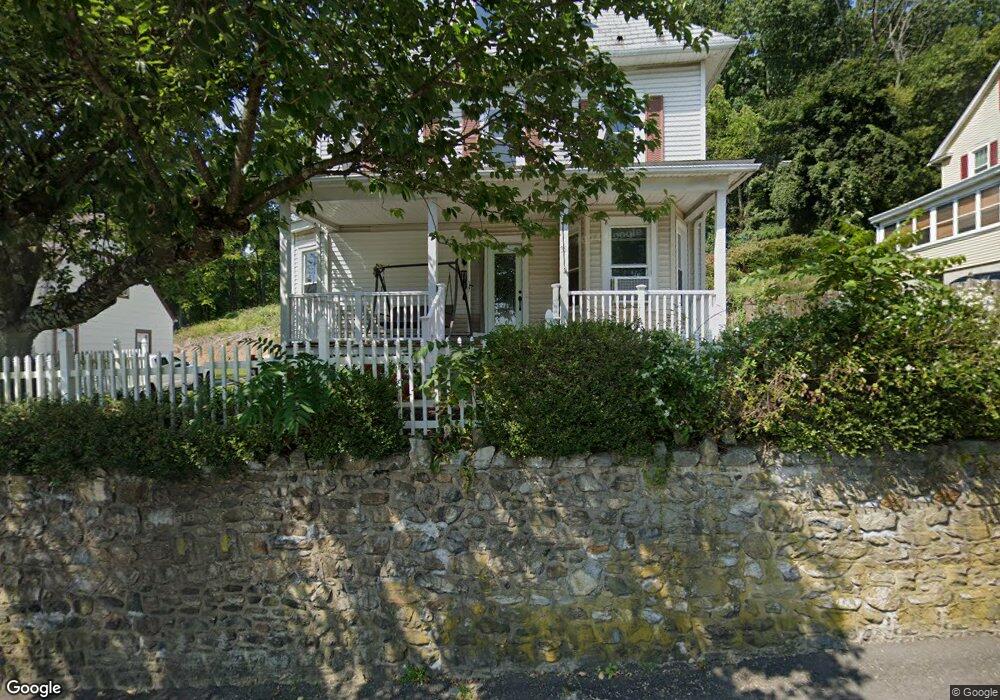
35 Fairview Ave High Bridge, NJ 08829
Estimated Value: $378,000 - $550,000
Studio
--
Bath
2,355
Sq Ft
$208/Sq Ft
Est. Value
About This Home
This home is located at 35 Fairview Ave, High Bridge, NJ 08829 and is currently estimated at $489,322, approximately $207 per square foot. 35 Fairview Ave is a home located in Hunterdon County with nearby schools including High Bridge Elementary School, High Bridge Middle School, and Voorhees High School.
Ownership History
Date
Name
Owned For
Owner Type
Purchase Details
Closed on
May 28, 2015
Sold by
Padilla Melanio J and Padilla Leticia A
Bought by
Florez Jonathan A
Current Estimated Value
Purchase Details
Closed on
May 19, 1998
Sold by
Padilla Melanio J and Lucero Leticia A
Bought by
Padilla Melanio J and Lucero Leticia A
Purchase Details
Closed on
Jun 13, 1996
Sold by
Smith Mary E
Bought by
Padilla Melanio J and Lucero Leticia A
Home Financials for this Owner
Home Financials are based on the most recent Mortgage that was taken out on this home.
Original Mortgage
$115,750
Interest Rate
8.05%
Mortgage Type
FHA
Purchase Details
Closed on
Nov 29, 1990
Sold by
Smith Mary E
Bought by
Smith Mary E
Create a Home Valuation Report for This Property
The Home Valuation Report is an in-depth analysis detailing your home's value as well as a comparison with similar homes in the area
Home Values in the Area
Average Home Value in this Area
Purchase History
| Date | Buyer | Sale Price | Title Company |
|---|---|---|---|
| Florez Jonathan A | $175,000 | Old Republic Natl Title Ins | |
| Padilla Melanio J | -- | Old Republic Natl Title Ins | |
| Padilla Melanio J | $117,294 | Lawyers Title Insurance Corp | |
| Smith Mary E | -- | -- |
Source: Public Records
Mortgage History
| Date | Status | Borrower | Loan Amount |
|---|---|---|---|
| Previous Owner | Padilla Melanio J | $115,750 |
Source: Public Records
Tax History
| Year | Tax Paid | Tax Assessment Tax Assessment Total Assessment is a certain percentage of the fair market value that is determined by local assessors to be the total taxable value of land and additions on the property. | Land | Improvement |
|---|---|---|---|---|
| 2025 | $12,220 | $387,500 | $106,100 | $281,400 |
| 2024 | $11,443 | $374,400 | $104,200 | $270,200 |
Source: Public Records
Map
Nearby Homes
- 13 Fairview Ave
- 77 Main St
- 10 Timbercroft Rd
- 44 Beavers St
- 0 Beavers St
- 21 E Main St
- 69 Beavers St
- 5 Deer Run Dr
- 56 E Main St
- 3 Chestnut Ct
- 2 Berrywood Ln
- 521 Cokesbury Rd
- 15 Patton St
- 128 Annandale High Bridge Rd
- 9 Charles Ct
- 36 Crestview Dr
- 8 Appollo Place
- 102-104 Cokesbury Rd
- 16 Perry Rd
- 3 Fulper Place
Your Personal Tour Guide
Ask me questions while you tour the home.