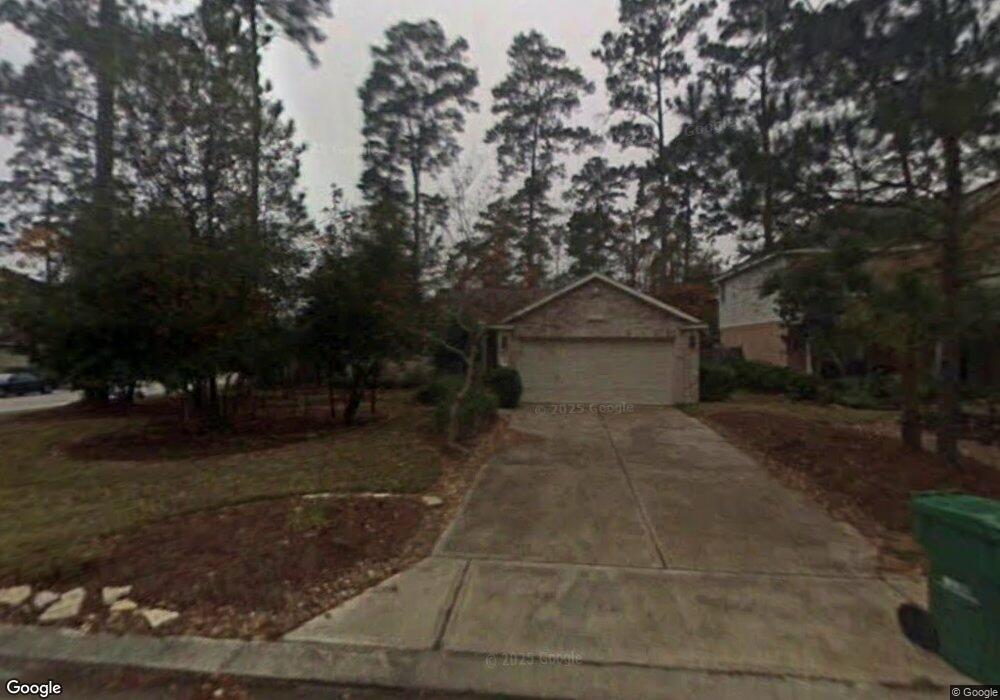
35 Fallsbury Way Spring, TX 77382
Alden Bridge NeighborhoodEstimated Value: $383,000 - $431,000
3
Beds
2
Baths
1,741
Sq Ft
$232/Sq Ft
Est. Value
About This Home
This home is located at 35 Fallsbury Way, Spring, TX 77382 and is currently estimated at $404,207, approximately $232 per square foot. 35 Fallsbury Way is a home located in Montgomery County with nearby schools including Buckalew Elementary School, Mitchell Intermediate School, and McCullough Junior High School.
Ownership History
Date
Name
Owned For
Owner Type
Purchase Details
Closed on
Nov 29, 2019
Sold by
Peeples Jeffrey Alan
Bought by
Nixon Hilary Anne
Current Estimated Value
Purchase Details
Closed on
Aug 27, 2001
Sold by
Waitman C P and Waitman A
Bought by
Peeples Jeffrey A
Home Financials for this Owner
Home Financials are based on the most recent Mortgage that was taken out on this home.
Original Mortgage
$118,800
Interest Rate
7.07%
Purchase Details
Closed on
Jun 16, 2000
Sold by
Rh Of Texas Ltd Partnership
Bought by
Waitman C P and Waitman A
Home Financials for this Owner
Home Financials are based on the most recent Mortgage that was taken out on this home.
Original Mortgage
$116,800
Interest Rate
8.5%
Purchase Details
Closed on
Dec 4, 1998
Sold by
The Ryland Group Inc
Bought by
Peeples Jeffrey A
Create a Home Valuation Report for This Property
The Home Valuation Report is an in-depth analysis detailing your home's value as well as a comparison with similar homes in the area
Home Values in the Area
Average Home Value in this Area
Purchase History
| Date | Buyer | Sale Price | Title Company |
|---|---|---|---|
| Nixon Hilary Anne | -- | None Available | |
| Peeples Jeffrey A | -- | Commerce Land Title | |
| Waitman C P | -- | Ryland Title Co | |
| Peeples Jeffrey A | -- | -- |
Source: Public Records
Mortgage History
| Date | Status | Borrower | Loan Amount |
|---|---|---|---|
| Previous Owner | Peeples Jeffrey A | $118,800 | |
| Previous Owner | Waitman C P | $116,800 | |
| Closed | Peeples Jeffrey A | $14,850 |
Source: Public Records
Tax History Compared to Growth
Tax History
| Year | Tax Paid | Tax Assessment Tax Assessment Total Assessment is a certain percentage of the fair market value that is determined by local assessors to be the total taxable value of land and additions on the property. | Land | Improvement |
|---|---|---|---|---|
| 2025 | $4,681 | $366,291 | -- | -- |
| 2024 | $4,195 | $332,992 | -- | -- |
| 2023 | $4,195 | $302,720 | $60,000 | $295,200 |
| 2022 | $5,578 | $275,200 | $60,000 | $251,030 |
| 2021 | $5,457 | $250,180 | $29,320 | $220,860 |
| 2020 | $5,623 | $243,100 | $29,320 | $213,780 |
| 2019 | $5,916 | $247,880 | $29,320 | $218,560 |
| 2018 | $5,098 | $242,950 | $29,320 | $218,560 |
| 2017 | $5,336 | $220,860 | $29,320 | $191,540 |
| 2016 | $5,336 | $220,860 | $29,320 | $191,540 |
| 2015 | $4,578 | $215,970 | $29,320 | $195,700 |
| 2014 | $4,578 | $196,340 | $29,320 | $177,690 |
Source: Public Records
Map
Nearby Homes
- 14 Wintergrass Place
- 11 Lyreleaf Place
- 66 N Brooksedge Cir
- 30 Lyreleaf Place
- 22 Almond Branch Place
- 2 Sweet Birch Place
- 14 Broadweather Place
- 147 N Wynnoak Cir
- 35 Dewdrift Place
- 3 Broadweather Place
- 15 Redland Place
- 14 Redland Place
- 23 Fortuneberry Place
- 413 New Forest Ln
- 70 Harvest Wind Place
- 171 W Sundance Cir
- 170 Linton Downs Place
- 309 Gotland Russ Ln
- 81 N Apple Springs Cir
- 33319 Lago Vista
- 39 Fallsbury Way
- 26 N Brooksedge Cir
- 43 Fallsbury Way
- 30 N Brooksedge Cir
- 31 S Wynnoak Cir
- 35 S Wynnoak Cir
- 47 Fallsbury Way
- 27 Fallsbury Ct
- 39 S Wynnoak Cir
- 39 S Wynnoak Cir
- 34 N Brooksedge Cir
- 3 Fallsbury Ct
- 23 Fallsbury Ct
- 43 S Wynnoak Cir
- 7 Fallsbury Ct
- 38 N Brooksedge Cir
- 47 S Wynnoak Cir
- 19 Fallsbury Ct
- 210 S Brooksedge Cir
- 51 Blackstar Place