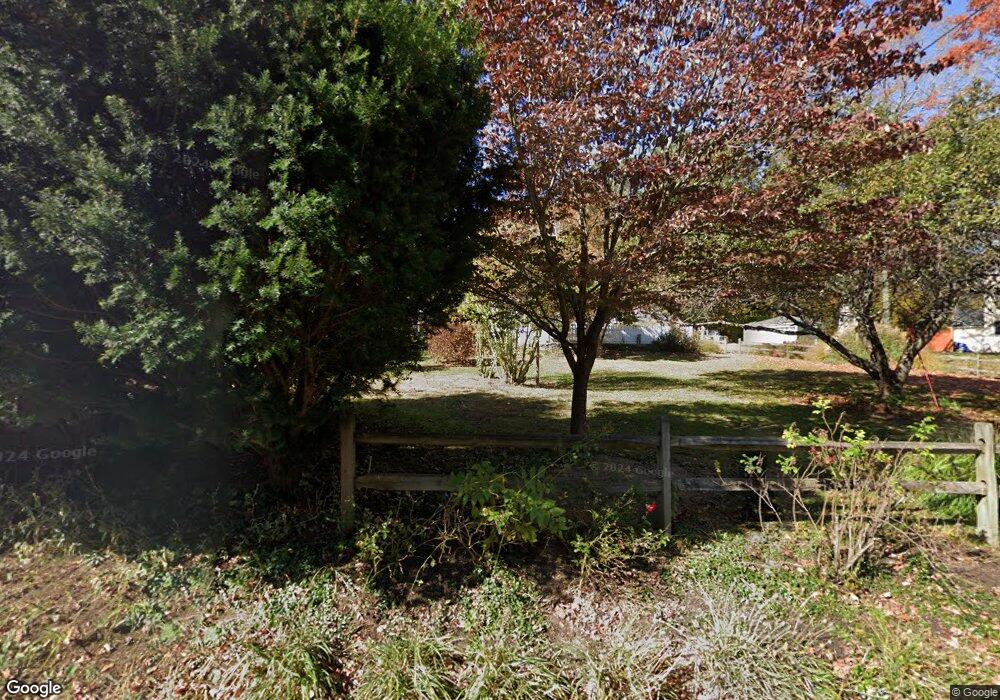
35 Ferry Rd Chester, CT 06412
Estimated Value: $479,000 - $523,401
2
Beds
3
Baths
1,829
Sq Ft
$271/Sq Ft
Est. Value
About This Home
This home is located at 35 Ferry Rd, Chester, CT 06412 and is currently estimated at $495,850, approximately $271 per square foot. 35 Ferry Rd is a home located in Middlesex County with nearby schools including Valley Regional High School.
Ownership History
Date
Name
Owned For
Owner Type
Purchase Details
Closed on
Jun 29, 2018
Sold by
Bernier Danny L
Bought by
Bernier Danny L and Bernier Tammy B
Current Estimated Value
Purchase Details
Closed on
Aug 17, 2009
Sold by
Broom Anthony
Bought by
Bernier Danny
Purchase Details
Closed on
Dec 1, 2000
Sold by
Dudley Claire C
Bought by
Broom Anthony
Create a Home Valuation Report for This Property
The Home Valuation Report is an in-depth analysis detailing your home's value as well as a comparison with similar homes in the area
Home Values in the Area
Average Home Value in this Area
Purchase History
| Date | Buyer | Sale Price | Title Company |
|---|---|---|---|
| Bernier Danny L | -- | -- | |
| Bernier Danny L | -- | -- | |
| Bernier Danny | $315,000 | -- | |
| Bernier Danny | $315,000 | -- | |
| Broom Anthony | $150,000 | -- | |
| Broom Anthony | $150,000 | -- |
Source: Public Records
Mortgage History
| Date | Status | Borrower | Loan Amount |
|---|---|---|---|
| Previous Owner | Broom Anthony | $50,000 | |
| Previous Owner | Broom Anthony | $23,000 | |
| Previous Owner | Broom Anthony | $204,000 |
Source: Public Records
Tax History
| Year | Tax Paid | Tax Assessment Tax Assessment Total Assessment is a certain percentage of the fair market value that is determined by local assessors to be the total taxable value of land and additions on the property. | Land | Improvement |
|---|---|---|---|---|
| 2025 | $7,653 | $282,590 | $57,330 | $225,260 |
| 2024 | $6,909 | $282,590 | $57,330 | $225,260 |
| 2023 | $6,146 | $206,930 | $57,320 | $149,610 |
| 2022 | $6,104 | $206,930 | $57,320 | $149,610 |
| 2021 | $4,610 | $206,930 | $57,320 | $149,610 |
| 2020 | $4,631 | $206,930 | $57,320 | $149,610 |
| 2019 | $5,958 | $206,930 | $57,320 | $149,610 |
| 2018 | $5,707 | $210,510 | $60,520 | $149,990 |
| 2017 | $5,549 | $210,510 | $60,520 | $149,990 |
| 2016 | $4,244 | $210,510 | $60,520 | $149,990 |
| 2015 | $5,330 | $210,510 | $60,520 | $149,990 |
| 2014 | $5,225 | $210,510 | $60,520 | $149,990 |
Source: Public Records
Map
Nearby Homes
Your Personal Tour Guide
Ask me questions while you tour the home.