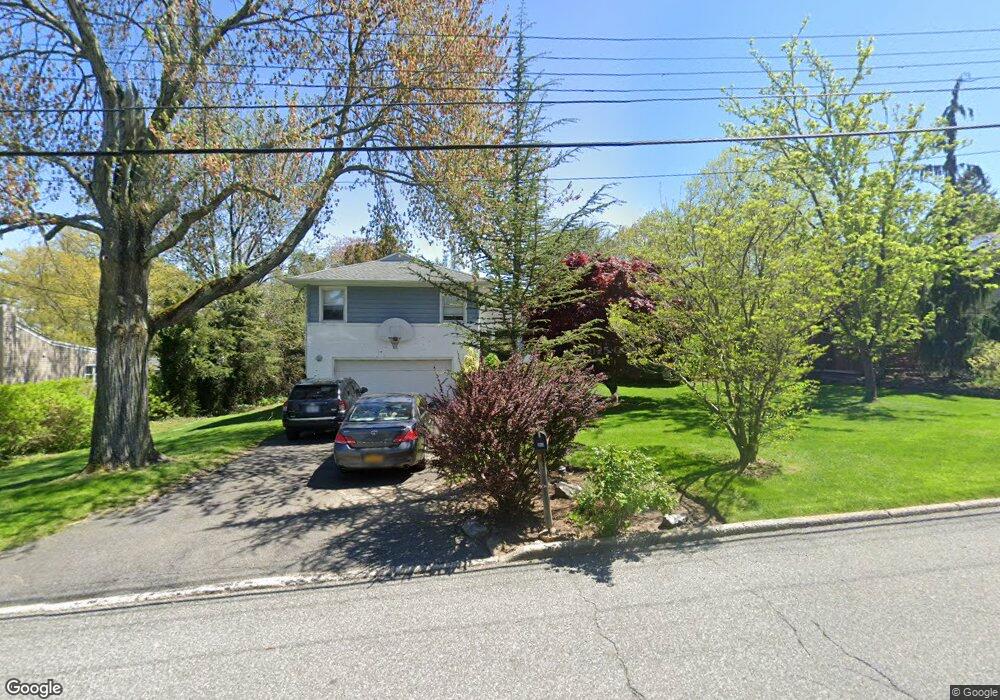
35 Fieldmere St New Rochelle, NY 10804
Estimated Value: $1,129,942 - $1,355,000
3
Beds
2
Baths
2,601
Sq Ft
$474/Sq Ft
Est. Value
About This Home
This home is located at 35 Fieldmere St, New Rochelle, NY 10804 and is currently estimated at $1,232,736, approximately $473 per square foot. 35 Fieldmere St is a home located in Westchester County with nearby schools including William B. Ward Elementary School, Albert Leonard Middle School, and New Rochelle High School.
Ownership History
Date
Name
Owned For
Owner Type
Purchase Details
Closed on
Feb 7, 2017
Sold by
Winston Michael J and Winston Jill A
Bought by
Winston Jill A
Current Estimated Value
Home Financials for this Owner
Home Financials are based on the most recent Mortgage that was taken out on this home.
Original Mortgage
$44,683
Outstanding Balance
$36,337
Interest Rate
4.09%
Mortgage Type
New Conventional
Estimated Equity
$1,196,399
Purchase Details
Closed on
Sep 14, 2005
Sold by
Wilson Deborah
Bought by
Winston Michael J and Winston Jill A
Home Financials for this Owner
Home Financials are based on the most recent Mortgage that was taken out on this home.
Original Mortgage
$155,000
Interest Rate
5.84%
Mortgage Type
Fannie Mae Freddie Mac
Purchase Details
Closed on
Jun 28, 1998
Sold by
Becker Steven and Becker Susan
Bought by
Wilson Deborah
Create a Home Valuation Report for This Property
The Home Valuation Report is an in-depth analysis detailing your home's value as well as a comparison with similar homes in the area
Purchase History
| Date | Buyer | Sale Price | Title Company |
|---|---|---|---|
| Winston Jill A | -- | None Available | |
| Winston Michael J | $840,000 | -- | |
| Wilson Deborah | $389,500 | -- |
Source: Public Records
Mortgage History
| Date | Status | Borrower | Loan Amount |
|---|---|---|---|
| Open | Winston Jill A | $44,683 | |
| Previous Owner | Winston Michael J | $155,000 |
Source: Public Records
Tax History
| Year | Tax Paid | Tax Assessment Tax Assessment Total Assessment is a certain percentage of the fair market value that is determined by local assessors to be the total taxable value of land and additions on the property. | Land | Improvement |
|---|---|---|---|---|
| 2025 | $23,347 | $17,000 | $5,500 | $11,500 |
| 2024 | $23,347 | $17,000 | $5,500 | $11,500 |
| 2023 | $18,815 | $17,000 | $5,500 | $11,500 |
| 2022 | $20,302 | $17,000 | $5,500 | $11,500 |
| 2021 | $20,209 | $17,000 | $5,500 | $11,500 |
| 2020 | $16,834 | $17,000 | $5,500 | $11,500 |
| 2019 | $19,043 | $17,000 | $5,500 | $11,500 |
| 2018 | $16,100 | $17,000 | $5,500 | $11,500 |
| 2017 | $2,429 | $17,000 | $5,500 | $11,500 |
| 2016 | $17,107 | $17,000 | $5,500 | $11,500 |
| 2015 | $18,861 | $17,000 | $5,500 | $11,500 |
| 2014 | $18,861 | $17,000 | $5,500 | $11,500 |
| 2013 | $18,861 | $17,000 | $5,500 | $11,500 |
Source: Public Records
Map
Nearby Homes
- 5 Avis Dr
- 457 Quaker Ridge Rd
- 44 Old Country Rd
- 97 Winding Brook Rd
- 236 Robert Dr
- 57 Belleau Ave
- 7 Brookridge Rd
- 19 Bonnie Way
- 415 Pinebrook Blvd
- 24 Aspen Rd
- 126 Taymil Rd
- 290 Overlook Rd
- 2 Coventry Ct
- 19 Beverly Rd
- 131 Fenimore Rd
- 1 Grand Park Ave
- 44 Fenimore Rd
- 45 Griffen Ave
- 48 Vine Rd
- 24 Highwood Ave
Your Personal Tour Guide
Ask me questions while you tour the home.