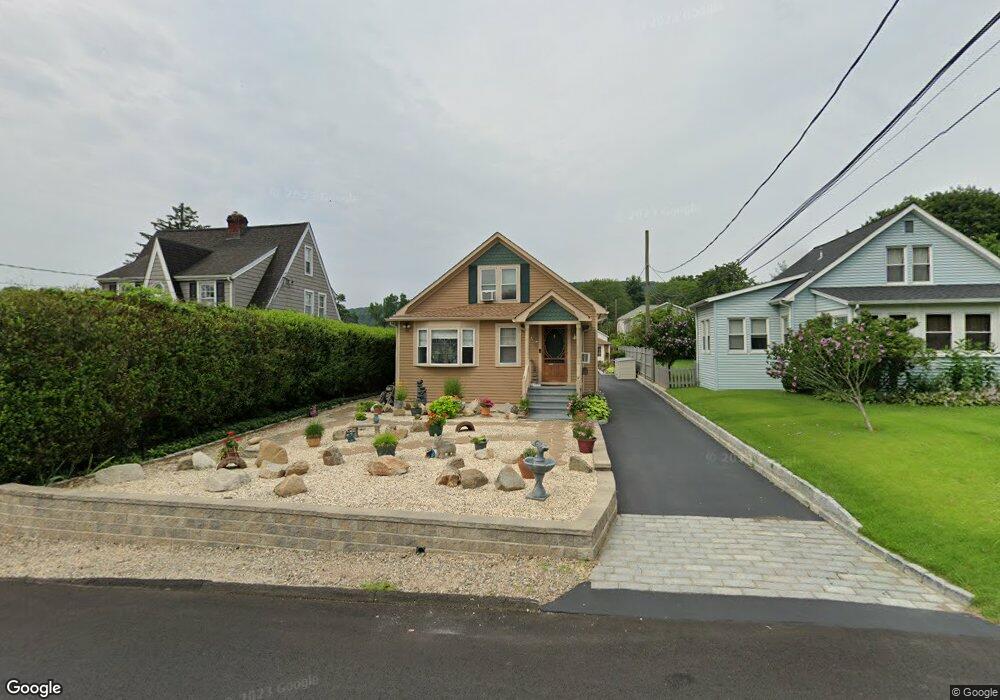
35 Fleetwood Ave Bethel, CT 06801
Estimated Value: $356,000 - $423,136
3
Beds
1
Bath
1,050
Sq Ft
$375/Sq Ft
Est. Value
About This Home
This home is located at 35 Fleetwood Ave, Bethel, CT 06801 and is currently estimated at $393,284, approximately $374 per square foot. 35 Fleetwood Ave is a home located in Fairfield County with nearby schools including R.M.T. Johnson School, Bethel Middle School, and Bethel High School.
Ownership History
Date
Name
Owned For
Owner Type
Purchase Details
Closed on
Aug 8, 2024
Sold by
Schwartz Gene
Bought by
Schwartz Marylen B
Current Estimated Value
Purchase Details
Closed on
Jan 12, 2021
Sold by
Schwartz Marylyn B
Bought by
Schwartz Marylyn B and Schwartz Gene
Home Financials for this Owner
Home Financials are based on the most recent Mortgage that was taken out on this home.
Original Mortgage
$170,519
Interest Rate
2.67%
Mortgage Type
Balloon
Purchase Details
Closed on
Sep 29, 1998
Sold by
Finney Edward D and Finney Judith R
Bought by
Schwartz Marilyn
Purchase Details
Closed on
Sep 24, 1987
Sold by
Buttery William
Bought by
Finney Edward
Create a Home Valuation Report for This Property
The Home Valuation Report is an in-depth analysis detailing your home's value as well as a comparison with similar homes in the area
Home Values in the Area
Average Home Value in this Area
Purchase History
| Date | Buyer | Sale Price | Title Company |
|---|---|---|---|
| Schwartz Marylen B | -- | None Available | |
| Schwartz Marylyn B | -- | None Available | |
| Schwartz Marylyn B | -- | None Available | |
| Schwartz Marilyn | $160,000 | -- | |
| Schwartz Marilyn | $160,000 | -- | |
| Finney Edward | $147,000 | -- |
Source: Public Records
Mortgage History
| Date | Status | Borrower | Loan Amount |
|---|---|---|---|
| Previous Owner | Schwartz Marylyn B | $170,519 | |
| Previous Owner | Finney Edward | $193,000 | |
| Previous Owner | Finney Edward | $53,200 | |
| Previous Owner | Finney Edward | $210,000 |
Source: Public Records
Tax History Compared to Growth
Tax History
| Year | Tax Paid | Tax Assessment Tax Assessment Total Assessment is a certain percentage of the fair market value that is determined by local assessors to be the total taxable value of land and additions on the property. | Land | Improvement |
|---|---|---|---|---|
| 2025 | $5,809 | $191,030 | $76,090 | $114,940 |
| 2024 | $5,572 | $191,030 | $76,090 | $114,940 |
| 2023 | $5,431 | $191,030 | $76,090 | $114,940 |
| 2022 | $4,775 | $138,040 | $76,090 | $61,950 |
| 2021 | $4,729 | $138,040 | $76,090 | $61,950 |
| 2020 | $4,657 | $138,040 | $76,090 | $61,950 |
| 2019 | $4,612 | $138,040 | $76,090 | $61,950 |
| 2018 | $4,537 | $138,040 | $76,090 | $61,950 |
| 2017 | $4,109 | $124,960 | $62,590 | $62,370 |
| 2016 | $4,020 | $124,960 | $62,590 | $62,370 |
| 2015 | $4,021 | $124,960 | $62,590 | $62,370 |
| 2014 | $4,012 | $124,960 | $62,590 | $62,370 |
Source: Public Records
Map
Nearby Homes
- 80 Tucker St Unit 80
- 10 South St Unit 66
- 81 Coalpit Hill Rd Unit B
- 30 Mountain Rd
- 15A Mountainville Rd
- 12 Mountainville Rd
- 9 Mountainville Rd
- 21 Oven Rock Rd
- 89 Knollwood Dr
- 173 South St
- 51 Kingswood Dr
- 27 Crows Nest Ln Unit 8F
- 148 Grassy Plain St Unit B
- 17 Briar Ridge Dr Unit 17
- 92 Woodcrest Ln
- 12 Eagle Rock Hill Unit 12
- 1 Skyline Dr
- 81 Deer Hill Ave
- 32 Crows Nest Ln Unit 23
- 2 Chestnut St
- 37 Fleetwood Ave
- 33 Fleetwood Ave
- 39 Fleetwood Ave
- 31 Fleetwood Ave
- 7 Grace Ct
- 29 Fleetwood Ave
- 9 Grace Ct
- 41 Fleetwood Ave
- 5 Grace Ct
- 27 1/2 Fleetwood Ave
- 36A Fleetwood Ave
- 36 Fleetwood Ave
- 11 Grace Ct
- 38 Fleetwood Ave
- 34 Fleetwood Ave
- 6 Hudson St
- 43 Fleetwood Ave
- 32 Fleetwood Ave
- 46 Fleetwood Ave
- 13 Grace Ct