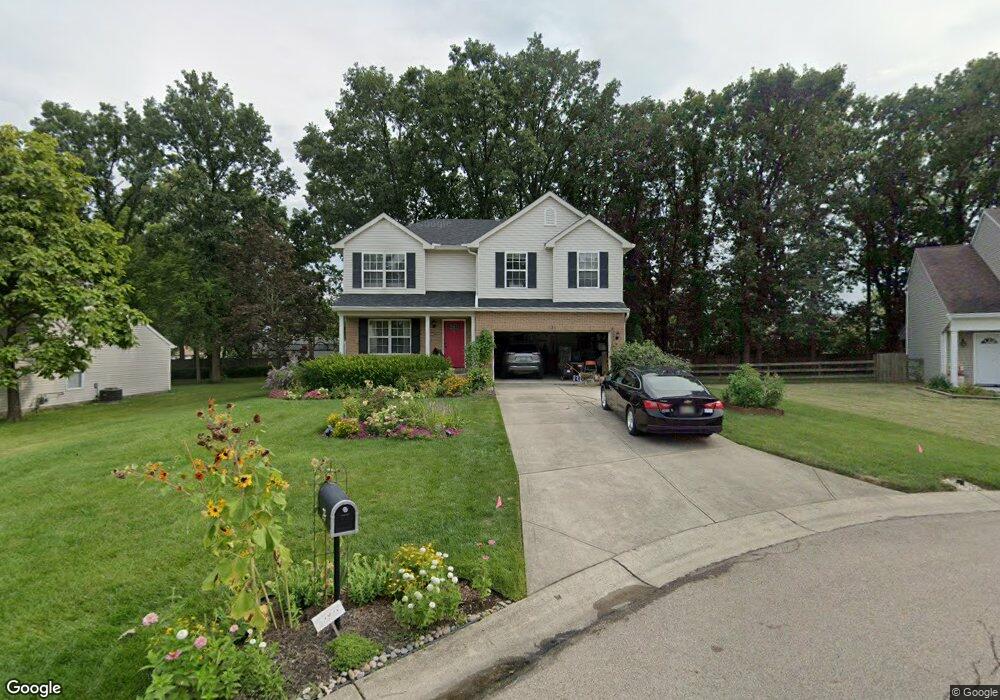
35 Forest View Ct Monroe, OH 45050
Estimated Value: $358,000 - $385,000
4
Beds
3
Baths
1,924
Sq Ft
$191/Sq Ft
Est. Value
About This Home
This home is located at 35 Forest View Ct, Monroe, OH 45050 and is currently estimated at $367,354, approximately $190 per square foot. 35 Forest View Ct is a home located in Butler County with nearby schools including Monroe Primary School, Monroe Elementary School, and Monroe Junior High School.
Ownership History
Date
Name
Owned For
Owner Type
Purchase Details
Closed on
Jun 23, 2006
Sold by
Olsen Aake D and Olsen Najmah A
Bought by
Salyers Lance S and Salyers Amber M
Current Estimated Value
Home Financials for this Owner
Home Financials are based on the most recent Mortgage that was taken out on this home.
Original Mortgage
$144,000
Outstanding Balance
$83,813
Interest Rate
6.68%
Mortgage Type
Purchase Money Mortgage
Estimated Equity
$283,541
Purchase Details
Closed on
Jul 31, 2003
Sold by
The Cristo Group Inc
Bought by
Olsen Aake D and Olsen Najmah A
Home Financials for this Owner
Home Financials are based on the most recent Mortgage that was taken out on this home.
Original Mortgage
$154,248
Interest Rate
5.31%
Mortgage Type
Purchase Money Mortgage
Create a Home Valuation Report for This Property
The Home Valuation Report is an in-depth analysis detailing your home's value as well as a comparison with similar homes in the area
Home Values in the Area
Average Home Value in this Area
Purchase History
| Date | Buyer | Sale Price | Title Company |
|---|---|---|---|
| Salyers Lance S | $180,000 | None Available | |
| Olsen Aake D | $162,367 | -- |
Source: Public Records
Mortgage History
| Date | Status | Borrower | Loan Amount |
|---|---|---|---|
| Open | Salyers Lance S | $144,000 | |
| Previous Owner | Olsen Aake D | $154,248 |
Source: Public Records
Tax History
| Year | Tax Paid | Tax Assessment Tax Assessment Total Assessment is a certain percentage of the fair market value that is determined by local assessors to be the total taxable value of land and additions on the property. | Land | Improvement |
|---|---|---|---|---|
| 2025 | $4,563 | $101,300 | $14,790 | $86,510 |
| 2024 | $4,563 | $101,300 | $14,790 | $86,510 |
| 2023 | $4,533 | $98,050 | $14,790 | $83,260 |
| 2022 | $3,577 | $70,430 | $14,790 | $55,640 |
| 2021 | $3,446 | $70,430 | $14,790 | $55,640 |
| 2020 | $3,570 | $70,430 | $14,790 | $55,640 |
| 2019 | $3,984 | $58,100 | $15,520 | $42,580 |
| 2018 | $3,179 | $58,100 | $15,520 | $42,580 |
| 2017 | $3,246 | $58,100 | $15,520 | $42,580 |
| 2016 | $3,018 | $51,790 | $15,520 | $36,270 |
| 2015 | $2,984 | $51,790 | $15,520 | $36,270 |
| 2014 | $2,794 | $51,790 | $15,520 | $36,270 |
| 2013 | $2,794 | $48,850 | $10,620 | $38,230 |
Source: Public Records
Map
Nearby Homes
- 965 Rustic Ct
- 160 Gorman Ct
- 15 Old Orchard Ln
- 125 Dobbin Ct
- 115 Meeker Ln
- 7970 Paradise Cove
- 7943 Peaceful Way
- 145 Trotter Ln
- 8031 Paradise Cove
- 850 Sands Ave
- 5512 Sunrise View Cir
- 7891 Celestial Cir
- 329 Ridgeview Ln
- 75 Teil Tree Ct
- 32 W Elm St
- 6893 Gaspar Trail
- 6935 Gaspar Trail
- 132 Village Ct
- 856 Hocking Meadow Cir
- 852 Willowbrook Dr
- 45 Forest View Ct
- 25 Forest View Ct
- 240 Woodsdale Dr
- 250 Woodsdale Dr
- 230 Woodsdale Dr
- 55 Forest View Ct
- 895 Helsinger Dr
- 220 Woodsdale Dr
- 30 Forest View Ct
- 40 Forest View Ct
- 10 Forest View Ct
- 50 Forest View Ct
- 874 Tam o Shanter Way
- 878 Tam o Shanter Way
- 870 Tam o Shanter Way
- 235 Woodsdale Dr
- 200 Woodsdale Dr
- 255 Woodsdale Dr
- 864 Tam o Shanter Way
- 300 Woodsdale Dr
Your Personal Tour Guide
Ask me questions while you tour the home.