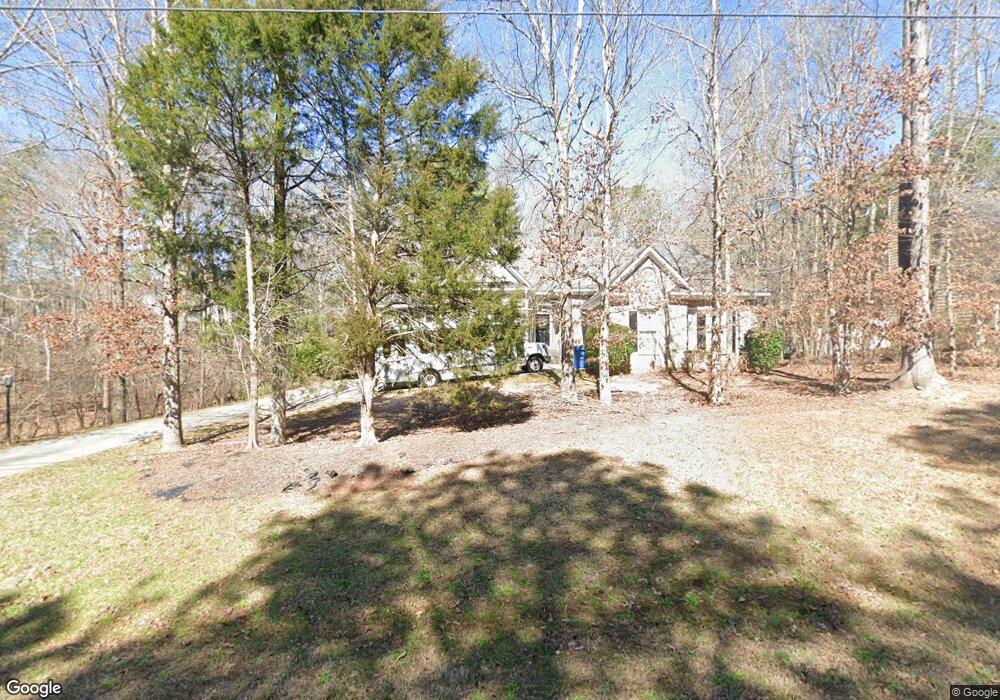
35 Goldfinch Dr Covington, GA 30016
Estimated Value: $296,000 - $380,000
3
Beds
2
Baths
2,340
Sq Ft
$146/Sq Ft
Est. Value
About This Home
This home is located at 35 Goldfinch Dr, Covington, GA 30016 and is currently estimated at $341,372, approximately $145 per square foot. 35 Goldfinch Dr is a home located in Newton County with nearby schools including Oak Hill Elementary School, Veterans Memorial Middle School, and Alcovy High School.
Ownership History
Date
Name
Owned For
Owner Type
Purchase Details
Closed on
Jun 6, 2019
Sold by
Pmc Sfr Holding Llc
Bought by
Pmc Sfr Borrower Llc
Current Estimated Value
Purchase Details
Closed on
Jun 28, 2016
Sold by
Pretium Mtg Acquisitio Trust
Bought by
Pretium Sfr Holding Llc
Purchase Details
Closed on
Aug 4, 2015
Sold by
Alexander Merrelyn L
Bought by
Wilmington Savings Fund Society Fsb
Purchase Details
Closed on
Apr 18, 2008
Sold by
Sullins Buddy C
Bought by
Sullins Buddy C and Sullins Deborah B
Purchase Details
Closed on
Sep 6, 2002
Sold by
Thompson Builders
Bought by
Alexander Merrelyn L
Home Financials for this Owner
Home Financials are based on the most recent Mortgage that was taken out on this home.
Original Mortgage
$179,500
Interest Rate
6.31%
Mortgage Type
New Conventional
Create a Home Valuation Report for This Property
The Home Valuation Report is an in-depth analysis detailing your home's value as well as a comparison with similar homes in the area
Home Values in the Area
Average Home Value in this Area
Purchase History
| Date | Buyer | Sale Price | Title Company |
|---|---|---|---|
| Pmc Sfr Borrower Llc | -- | -- | |
| Pretium Sfr Holding Llc | $155,800 | -- | |
| Wilmington Savings Fund Society Fsb | $185,000 | -- | |
| Sullins Buddy C | -- | -- | |
| Alexander Merrelyn L | $199,500 | -- |
Source: Public Records
Mortgage History
| Date | Status | Borrower | Loan Amount |
|---|---|---|---|
| Previous Owner | Alexander Merrelyn L | $179,500 |
Source: Public Records
Tax History Compared to Growth
Tax History
| Year | Tax Paid | Tax Assessment Tax Assessment Total Assessment is a certain percentage of the fair market value that is determined by local assessors to be the total taxable value of land and additions on the property. | Land | Improvement |
|---|---|---|---|---|
| 2024 | $3,898 | $153,880 | $16,800 | $137,080 |
| 2023 | $4,166 | $153,520 | $7,600 | $145,920 |
| 2022 | $2,874 | $105,920 | $7,600 | $98,320 |
| 2021 | $3,008 | $99,200 | $7,600 | $91,600 |
| 2020 | $2,598 | $77,320 | $7,600 | $69,720 |
| 2019 | $2,270 | $66,560 | $7,600 | $58,960 |
| 2018 | $2,178 | $63,440 | $7,600 | $55,840 |
| 2017 | $2,147 | $62,520 | $7,600 | $54,920 |
| 2016 | $2,140 | $62,320 | $4,000 | $58,320 |
| 2015 | $1,929 | $60,080 | $2,000 | $58,080 |
| 2014 | $1,924 | $60,080 | $0 | $0 |
Source: Public Records
Map
Nearby Homes
- 0 Goldfinch Dr
- 0 Goldfinch Dr Unit 7564125
- 50 Butler Bridge Cir
- 435 Butler Bridge Cir
- 5240 Highway 20 S
- 110 Chapel Heights Way
- 6023 Highway 20 S
- 35 Fourwood Dr
- 190 the Falls Blvd
- 134 Oak Hill West Rd
- 4.18 ACRES Bailey Creek Rd
- 175 Cambridge Way Unit 2
- 0 Butler Bridge Rd Unit 19792679
- 0 Butler Bridge Rd Unit 19792691
- 55 the Falls Blvd
- 60 Boardwalk Ave Unit 3
- 120 Wintergreen Ct
- 35 Cambridge Way
- 60 Parkman Trail
- 170 Gibson Way
- 45 Goldfinch Dr Unit 2
- 119 Goldfinch Dr
- 535 Robin Rd
- 55 Goldfinch Dr
- 30 Goldfinch Dr
- 525 Robin Rd
- 40 Goldfinch Dr Unit 2
- 545 Robin Rd Unit 2
- 565 Robin Rd Unit 2
- 515 Robin Rd Unit 2
- 515 Robin Rd
- 65 Goldfinch Dr Unit 2
- 110 Goldfinch Dr Unit 2
- 75 Goldfinch Dr
- 85 Goldfinch Dr
- 540 Robin Rd
- 95 Goldfinch Dr
- 575 Robin Rd
- 510 Robin Rd Unit 2
- 105 Goldfinch Dr