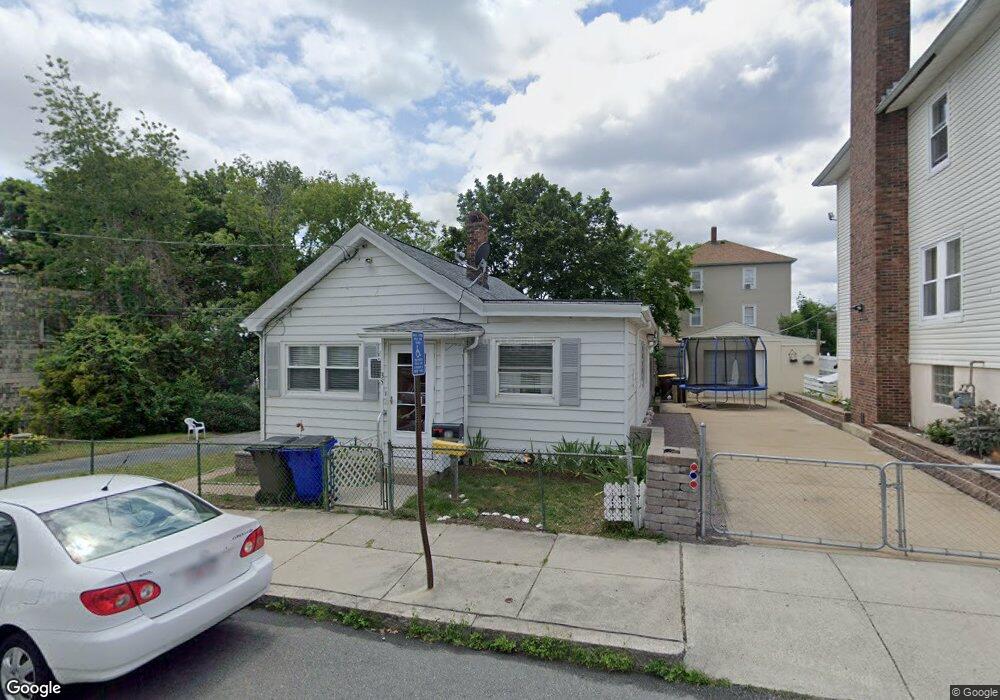
35 Hambly St Fall River, MA 02721
Maplewood NeighborhoodEstimated Value: $281,000 - $386,000
2
Beds
1
Bath
1,098
Sq Ft
$294/Sq Ft
Est. Value
About This Home
This home is located at 35 Hambly St, Fall River, MA 02721 and is currently estimated at $322,935, approximately $294 per square foot. 35 Hambly St is a home located in Bristol County with nearby schools including Letourneau Elementary School, Matthew J. Kuss Middle School, and B M C Durfee High School.
Ownership History
Date
Name
Owned For
Owner Type
Purchase Details
Closed on
May 5, 2009
Sold by
Oldrid Robert and Barlow-Oldrid Marilyn
Bought by
Barlow-Oldrid Marilyn
Current Estimated Value
Create a Home Valuation Report for This Property
The Home Valuation Report is an in-depth analysis detailing your home's value as well as a comparison with similar homes in the area
Home Values in the Area
Average Home Value in this Area
Purchase History
| Date | Buyer | Sale Price | Title Company |
|---|---|---|---|
| Barlow-Oldrid Marilyn | -- | -- |
Source: Public Records
Tax History
| Year | Tax Paid | Tax Assessment Tax Assessment Total Assessment is a certain percentage of the fair market value that is determined by local assessors to be the total taxable value of land and additions on the property. | Land | Improvement |
|---|---|---|---|---|
| 2025 | $2,994 | $261,500 | $107,700 | $153,800 |
| 2024 | $2,821 | $245,500 | $103,700 | $141,800 |
| 2023 | $2,583 | $210,500 | $85,700 | $124,800 |
| 2022 | $2,423 | $192,000 | $81,600 | $110,400 |
| 2021 | $2,294 | $165,900 | $77,600 | $88,300 |
| 2020 | $2,325 | $160,900 | $76,500 | $84,400 |
| 2019 | $2,237 | $153,400 | $73,700 | $79,700 |
| 2018 | $2,216 | $151,600 | $79,800 | $71,800 |
| 2017 | $2,061 | $147,200 | $76,100 | $71,100 |
| 2016 | $2,021 | $148,300 | $80,900 | $67,400 |
| 2015 | $1,940 | $148,300 | $80,900 | $67,400 |
| 2014 | $1,835 | $145,900 | $78,500 | $67,400 |
Source: Public Records
Map
Nearby Homes
- 25 Hambly St
- 54 Garfield St
- 53 Hambly St
- 38 Garfield St
- 15 Hambly St
- 15 Hambly St Unit 2
- 58 Garfield St
- 58 Garfield St Unit 1
- 36 Hambly St
- 24 Garfield St
- 66 Garfield St
- 26 Hambly St
- 46 Hambly St
- 46 Hambly St Unit 2
- 46 Hambly St Unit 1
- 71 Hambly St
- 64 Hambly St
- 3 Hambly St
- 1309 Globe St
- 1538 Slade St
Your Personal Tour Guide
Ask me questions while you tour the home.