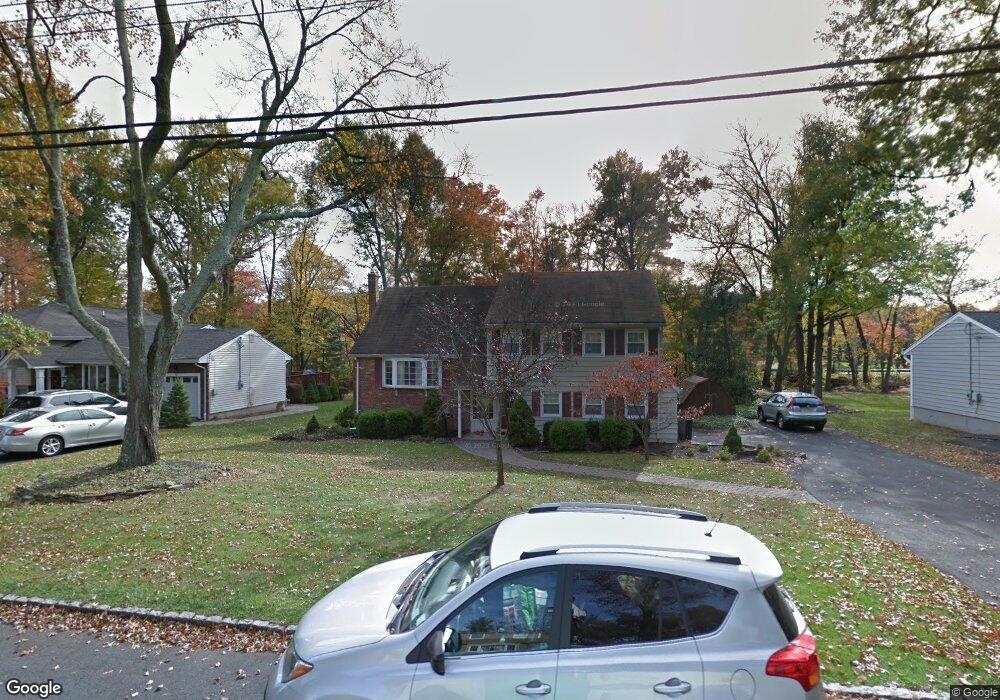
35 Hampton Dr Berkeley Heights, NJ 07922
Estimated Value: $846,000 - $1,011,000
Studio
--
Bath
2,363
Sq Ft
$400/Sq Ft
Est. Value
About This Home
This home is located at 35 Hampton Dr, Berkeley Heights, NJ 07922 and is currently estimated at $945,121, approximately $399 per square foot. 35 Hampton Dr is a home located in Union County with nearby schools including Columbia Middle School, Governor Livingston High School, and Scotch Plains Baptist Christian Day School.
Ownership History
Date
Name
Owned For
Owner Type
Purchase Details
Closed on
Nov 24, 2010
Sold by
Tramm Jason C
Bought by
Sinclair Timothy and Sinclair Alexis
Current Estimated Value
Home Financials for this Owner
Home Financials are based on the most recent Mortgage that was taken out on this home.
Original Mortgage
$462,958
Outstanding Balance
$307,006
Interest Rate
4.37%
Mortgage Type
FHA
Estimated Equity
$638,115
Purchase Details
Closed on
Sep 7, 2010
Sold by
Tramm Jason C and Tramm Angel Sue
Bought by
Tramm Jason C
Purchase Details
Closed on
Sep 19, 2008
Sold by
Sefcik Sophie R
Bought by
Tramm Jason C and Tramm Angel Sue
Home Financials for this Owner
Home Financials are based on the most recent Mortgage that was taken out on this home.
Original Mortgage
$408,000
Interest Rate
6.54%
Mortgage Type
Purchase Money Mortgage
Create a Home Valuation Report for This Property
The Home Valuation Report is an in-depth analysis detailing your home's value as well as a comparison with similar homes in the area
Home Values in the Area
Average Home Value in this Area
Purchase History
| Date | Buyer | Sale Price | Title Company |
|---|---|---|---|
| Sinclair Timothy | $475,000 | Fidelity Natl Title Ins Co | |
| Tramm Jason C | $200,065 | None Available | |
| Tramm Jason C | $510,000 | None Available |
Source: Public Records
Mortgage History
| Date | Status | Borrower | Loan Amount |
|---|---|---|---|
| Open | Sinclair Timothy | $462,958 | |
| Previous Owner | Tramm Jason C | $408,000 |
Source: Public Records
Tax History
| Year | Tax Paid | Tax Assessment Tax Assessment Total Assessment is a certain percentage of the fair market value that is determined by local assessors to be the total taxable value of land and additions on the property. | Land | Improvement |
|---|---|---|---|---|
| 2025 | $12,904 | $315,900 | $164,600 | $151,300 |
| 2024 | $12,717 | $301,000 | $164,600 | $136,400 |
| 2023 | $12,717 | $301,000 | $164,600 | $136,400 |
| 2022 | $12,639 | $301,000 | $164,600 | $136,400 |
| 2021 | $12,570 | $301,000 | $164,600 | $136,400 |
| 2020 | $12,636 | $301,000 | $164,600 | $136,400 |
| 2019 | $12,489 | $299,000 | $164,600 | $134,400 |
| 2018 | $12,229 | $299,000 | $164,600 | $134,400 |
| 2017 | $12,080 | $299,000 | $164,600 | $134,400 |
| 2016 | $11,867 | $299,000 | $164,600 | $134,400 |
| 2015 | $11,802 | $299,000 | $164,600 | $134,400 |
| 2014 | $11,494 | $299,000 | $164,600 | $134,400 |
Source: Public Records
Map
Nearby Homes
- 220 Horseshoe Rd
- 46 Coolidge Dr
- 585 Plainfield Ave
- 85 Appletree Row
- 49 Pine Grove Rd
- 10 Wolford Ct
- 25 Oechsner Ct
- 10 Twin Brooks Ct
- 317 Plainfield Ave
- 41 Brambling Rd
- 264 Ridge Rd
- 115 Old Somerset Rd
- 90 Century Ln
- 235 Plainfield Ave
- 155 Dogwood Ln
- 165 Jasmine Unit 613
- 31 Angela Way Unit 731
- 127 Myrtle Rd
- 221 Myrtle Rd
- 204 Honeysuckle Ln
Your Personal Tour Guide
Ask me questions while you tour the home.