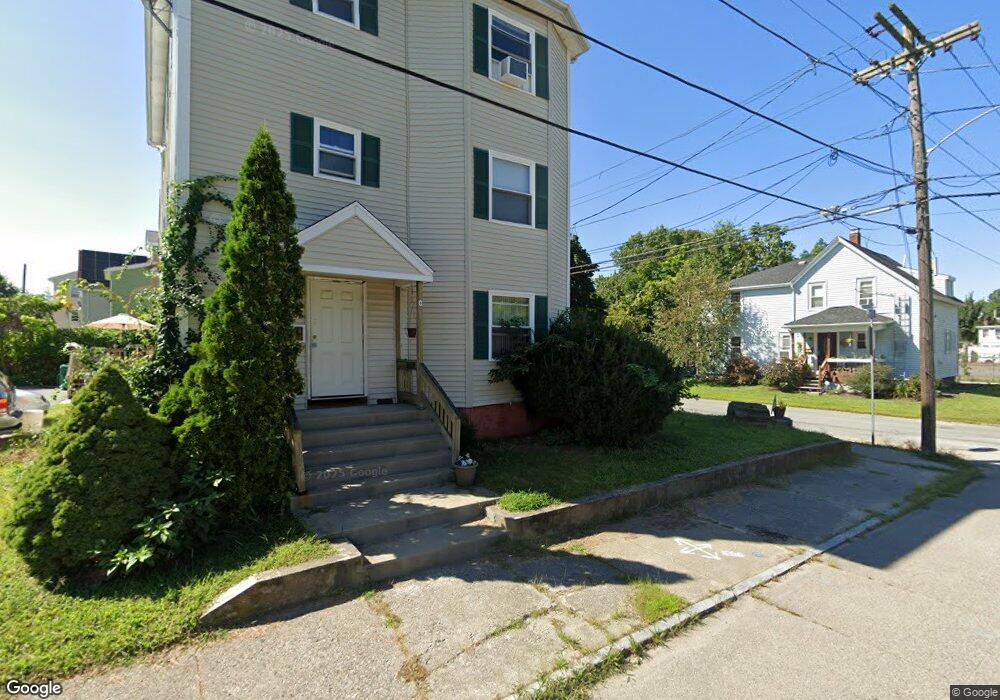
35 Hazel St Unit A Attleboro, MA 02703
Estimated Value: $213,000 - $256,000
3
Beds
1
Bath
886
Sq Ft
$273/Sq Ft
Est. Value
About This Home
This home is located at 35 Hazel St Unit A, Attleboro, MA 02703 and is currently estimated at $241,788, approximately $272 per square foot. 35 Hazel St Unit A is a home located in Bristol County with nearby schools including Peter Thacher Elementary School, Wamsutta Middle School, and Attleboro High School.
Ownership History
Date
Name
Owned For
Owner Type
Purchase Details
Closed on
Feb 18, 1997
Sold by
Community Dev Attlebor
Bought by
Avakian Robert J and Vasterling Holly
Current Estimated Value
Home Financials for this Owner
Home Financials are based on the most recent Mortgage that was taken out on this home.
Original Mortgage
$48,500
Outstanding Balance
$5,503
Interest Rate
7.6%
Mortgage Type
Purchase Money Mortgage
Estimated Equity
$236,285
Create a Home Valuation Report for This Property
The Home Valuation Report is an in-depth analysis detailing your home's value as well as a comparison with similar homes in the area
Home Values in the Area
Average Home Value in this Area
Purchase History
We collect this data history from publicly available records. To have your information removed, we recommend requesting removal directly through your county’s website.
| Date | Buyer | Sale Price | Title Company |
|---|---|---|---|
| Avakian Robert J | $50,000 | -- |
Source: Public Records
Mortgage History
We collect this data history from publicly available records. To have your information removed, we recommend requesting removal directly through your county’s website.
| Date | Status | Borrower | Loan Amount |
|---|---|---|---|
| Open | Avakian Robert J | $48,500 |
Source: Public Records
Tax History
| Year | Tax Paid | Tax Assessment Tax Assessment Total Assessment is a certain percentage of the fair market value that is determined by local assessors to be the total taxable value of land and additions on the property. | Land | Improvement |
|---|---|---|---|---|
| 2025 | $2,769 | $220,600 | $0 | $220,600 |
| 2024 | $2,554 | $200,600 | $0 | $200,600 |
| 2023 | $2,210 | $161,400 | $0 | $161,400 |
| 2022 | $2,043 | $141,400 | $0 | $141,400 |
| 2021 | $1,946 | $131,500 | $0 | $131,500 |
| 2020 | $1,900 | $130,500 | $0 | $130,500 |
| 2019 | $1,926 | $136,000 | $0 | $136,000 |
| 2018 | $2,450 | $124,600 | $0 | $124,600 |
| 2017 | $1,621 | $111,400 | $0 | $111,400 |
| 2016 | $1,166 | $78,700 | $0 | $78,700 |
| 2015 | $1,612 | $109,600 | $0 | $109,600 |
| 2014 | $1,648 | $111,000 | $0 | $111,000 |
Source: Public Records
Map
Nearby Homes
- 36 Hazel St
- 91 East St
- 38 James St
- 178 S Main St
- 61 Pine St Unit 7
- 567 Park St
- 40 Park St Unit 4
- 0 Rosedale Ln Unit 73469293
- 70 Riverside Ave
- 4 Wolfenden St
- 25 4th St
- 64 Mechanic St Unit 3
- 64 Mechanic St
- 75 Dennis St Unit 3
- 8 Rathbun Willard Dr
- 35 Intervale Ave
- 38 Hope St
- 40 Benefit St
- 10 John St
- 75 Benefit St
Your Personal Tour Guide
Ask me questions while you tour the home.