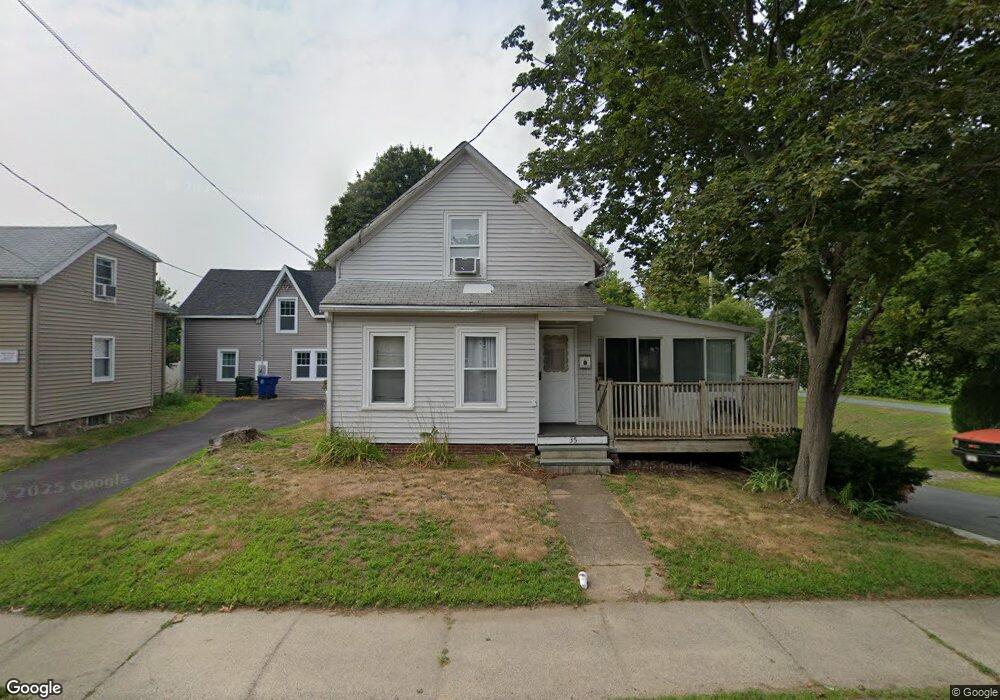
35 Hobart St Danvers, MA 01923
Estimated Value: $551,000 - $615,577
3
Beds
2
Baths
1,207
Sq Ft
$485/Sq Ft
Est. Value
About This Home
This home is located at 35 Hobart St, Danvers, MA 01923 and is currently estimated at $585,644, approximately $485 per square foot. 35 Hobart St is a home located in Essex County with nearby schools including St. Mary of the Annunciation School and St. John's Prep.
Ownership History
Date
Name
Owned For
Owner Type
Purchase Details
Closed on
Dec 1, 1994
Sold by
Hyde Linda S
Bought by
Rather Benjamin F and Rather Barbara H
Current Estimated Value
Purchase Details
Closed on
Apr 27, 1990
Sold by
Collins Loretto H
Bought by
Mcnichol William J
Create a Home Valuation Report for This Property
The Home Valuation Report is an in-depth analysis detailing your home's value as well as a comparison with similar homes in the area
Home Values in the Area
Average Home Value in this Area
Purchase History
| Date | Buyer | Sale Price | Title Company |
|---|---|---|---|
| Rather Benjamin F | $99,000 | -- | |
| Mcnichol William J | $40,000 | -- | |
| Mcnichol William J | $40,000 | -- |
Source: Public Records
Mortgage History
| Date | Status | Borrower | Loan Amount |
|---|---|---|---|
| Open | Mcnichol William J | $252,296 |
Source: Public Records
Tax History Compared to Growth
Tax History
| Year | Tax Paid | Tax Assessment Tax Assessment Total Assessment is a certain percentage of the fair market value that is determined by local assessors to be the total taxable value of land and additions on the property. | Land | Improvement |
|---|---|---|---|---|
| 2025 | $5,682 | $517,000 | $319,300 | $197,700 |
| 2024 | $5,661 | $509,500 | $319,300 | $190,200 |
| 2023 | $5,389 | $458,600 | $283,200 | $175,400 |
| 2022 | $5,191 | $410,000 | $247,200 | $162,800 |
| 2021 | $4,909 | $367,700 | $224,400 | $143,300 |
| 2020 | $4,592 | $351,600 | $217,200 | $134,400 |
| 2019 | $4,594 | $345,900 | $210,000 | $135,900 |
| 2018 | $4,371 | $322,800 | $204,000 | $118,800 |
| 2017 | $4,315 | $304,100 | $189,600 | $114,500 |
| 2016 | $4,154 | $292,500 | $181,200 | $111,300 |
| 2015 | $3,912 | $262,400 | $157,200 | $105,200 |
Source: Public Records
Map
Nearby Homes
- 14 Williams St Unit C17
- 25 Cherry St Unit 3
- 37 Holten St Unit 2
- 11 Holten St
- 6 Kimberly Dr
- 8 Putnam St Unit 3
- 35 Locust St Unit 3
- 5 Beacon St
- 35 High St Unit 3D
- 38 High St Unit 4
- 20 Ash St Unit 3
- 20 Ash St Unit 1
- 14 1/2 Hampshire St
- 5 Hampshire St
- 12 Whipple St
- 63 Adams St
- 100 Poplar St
- 37 Constitution Ln Unit 12
- 24 Purchase St
- 4 Brookvale Dr
- 35 1/2 Hobart St
- 37 Hobart St
- 39 Hobart St
- 34 Hobart St
- 38 Hobart St
- 41 Hobart St
- 17 Pickering St
- 15 Pickering St
- 27 Pickering St
- 31 Hobart St
- 43 Hobart St
- 43 Hobart St Unit 2
- 43 Hobart St Unit 1
- 43 Hobart St Unit B
- 28 Pickering St
- 30 Hobart St Unit 15
- 30 Hobart St Unit 14
- 30 Hobart St Unit 13
- 30 Hobart St Unit 12
- 30 Hobart St Unit 11