Estimated Value: $159,821 - $200,000
--
Bed
1
Bath
1,281
Sq Ft
$141/Sq Ft
Est. Value
About This Home
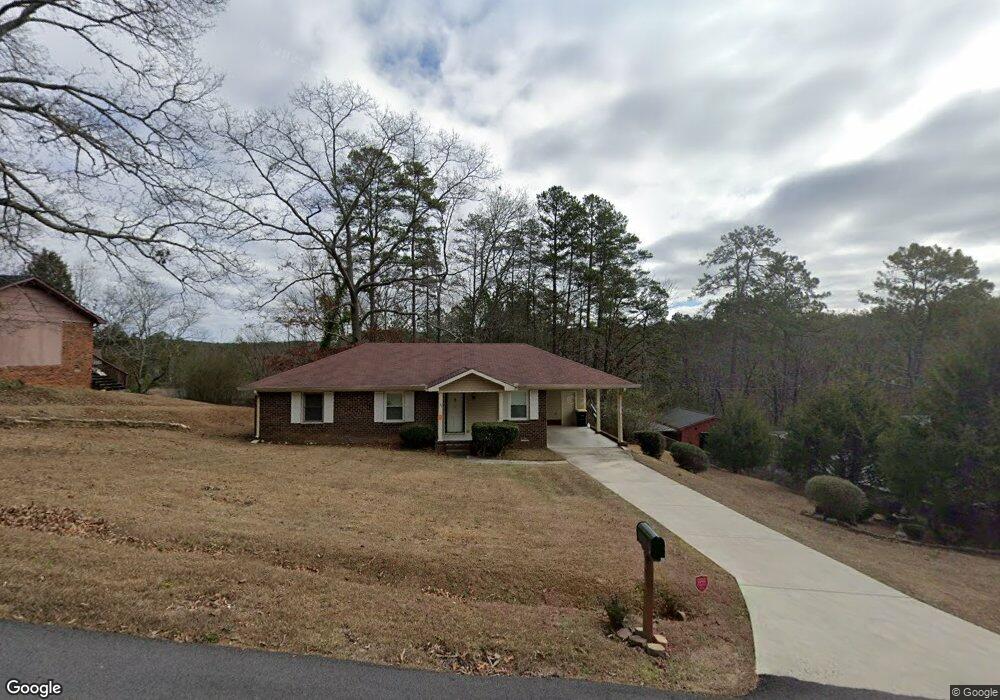
This home is located at 35 Honeysuckle Ridge Rd SE, Rome, GA 30161 and is currently estimated at $181,205, approximately $141 per square foot. 35 Honeysuckle Ridge Rd SE is a home located in Floyd County with nearby schools including Pepperell Middle School, Pepperell High School, and Montessori School of Rome.
Ownership History
Date
Name
Owned For
Owner Type
Purchase Details
Closed on
May 3, 2021
Sold by
Baker Christine F
Bought by
Calloway Braddon and Calloway Braxton
Current Estimated Value
Home Financials for this Owner
Home Financials are based on the most recent Mortgage that was taken out on this home.
Original Mortgage
$86,250
Outstanding Balance
$65,299
Interest Rate
3.1%
Mortgage Type
New Conventional
Estimated Equity
$115,906
Purchase Details
Closed on
Aug 21, 1986
Sold by
Calloway Anthony L and Calloway Kathleen W
Bought by
Baker Christine F
Purchase Details
Closed on
Jun 14, 1976
Bought by
P and R
Purchase Details
Closed on
Feb 20, 1975
Sold by
Dempsey Rod and Ronnie Lee Youngblood
Bought by
Calloway Anthony L and Calloway Kathleen W
Purchase Details
Closed on
Apr 25, 1973
Sold by
Builders Realty & Dev Co
Bought by
Dempsey Rod and Ronnie Lee Youngblood
Purchase Details
Closed on
Jul 29, 1970
Bought by
Builders Realty & Dev Co
Create a Home Valuation Report for This Property
The Home Valuation Report is an in-depth analysis detailing your home's value as well as a comparison with similar homes in the area
Home Values in the Area
Average Home Value in this Area
Purchase History
| Date | Buyer | Sale Price | Title Company |
|---|---|---|---|
| Calloway Braddon | $115,000 | -- | |
| Baker Christine F | $34,000 | -- | |
| P | $22,900 | -- | |
| Calloway Anthony L | $23,700 | -- | |
| Dempsey Rod | $22,500 | -- | |
| Builders Realty & Dev Co | -- | -- |
Source: Public Records
Mortgage History
| Date | Status | Borrower | Loan Amount |
|---|---|---|---|
| Open | Calloway Braddon | $86,250 |
Source: Public Records
Tax History Compared to Growth
Tax History
| Year | Tax Paid | Tax Assessment Tax Assessment Total Assessment is a certain percentage of the fair market value that is determined by local assessors to be the total taxable value of land and additions on the property. | Land | Improvement |
|---|---|---|---|---|
| 2024 | $1,794 | $46,267 | $4,444 | $41,823 |
| 2023 | $1,639 | $35,827 | $4,040 | $31,787 |
| 2022 | $1,094 | $29,986 | $3,232 | $26,754 |
| 2021 | $396 | $26,894 | $3,232 | $23,662 |
| 2020 | $402 | $25,013 | $2,424 | $22,589 |
| 2019 | $395 | $23,930 | $2,424 | $21,506 |
| 2018 | $395 | $22,745 | $2,424 | $20,321 |
| 2017 | $386 | $22,150 | $2,424 | $19,726 |
| 2016 | $371 | $21,281 | $2,400 | $18,881 |
| 2015 | $328 | $21,281 | $2,400 | $18,881 |
| 2014 | $328 | $21,281 | $2,400 | $18,881 |
Source: Public Records
Map
Nearby Homes
- 5 Jewell Dr SE
- 13 Jewell Dr SE
- 15 Jewell Dr SE Unit 3
- 3 Jewell Dr SE Unit 22
- 14 Jewell Dr SE
- 7 Shirley Ln SE
- 0 Honeysuckle Ridge Rd SE Unit 1522674
- 18 Devonshire Dr SE
- 0 Lot #27 Hermitage Rd
- 0 Warwick Way SE Unit 10624495
- 0 Warwick Way SE Unit 7666193
- 452 Mountain View Rd SE
- 9 Wellington Way SE
- 145 Mountain View Rd SE
- 11 Cambridge Dr SE
- 28 Rushden Way SE
- 30 Rushden Way SE
- 85 Cambridge Dr SE
- 18 Wellington Way SE
- 0 Hillindale Dr SE Unit 7574083
- 37 Honeysuckle Ridge Rd SE
- 33 Honeysuckle Ridge Rd SE
- 33 Honeysuckle Ridge Rd SE
- 33 Honeysuckle Ridge Rd SE
- 33 Honeysuckle Ridge Rd SE
- 33 Honeysuckle Ridge Rd SE
- 8 Blueberry Ln SE
- 4 Blueberry Ln SE
- 39 Honeysuckle Ridge Rd SE
- 31 Honeysuckle Ridge Rd SE
- 2 Blueberry Ln SE
- 41 Honeysuckle Ridge Rd SE
- 48 Honeysuckle Ridge Rd SE
- 5 Blueberry Ln SE
- 50 Honeysuckle Ridge Rd SE
- 52 Honeysuckle Ridge Rd SE
- 40 Honeysuckle Ridge Rd SE
- 43 Honeysuckle Ridge Rd SE
- 35 Mockingbird Cir SE
- 35 Mockingbird Cir SE