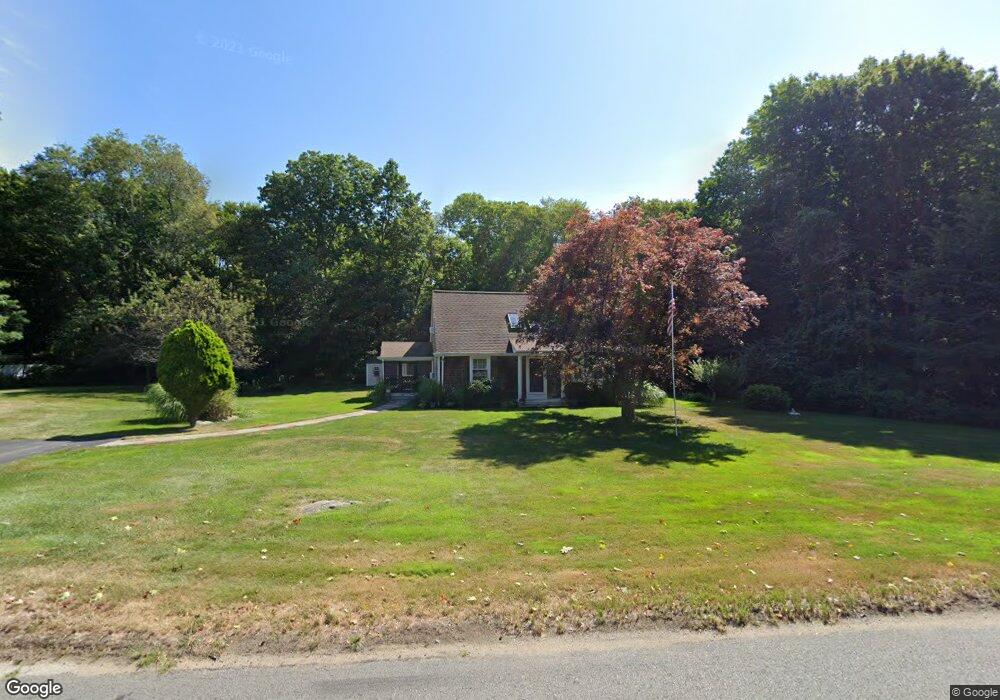
35 Hornbine Rd Swansea, MA 02777
Northeast Swansea NeighborhoodEstimated Value: $288,000 - $649,000
3
Beds
3
Baths
1,407
Sq Ft
$350/Sq Ft
Est. Value
About This Home
This home is located at 35 Hornbine Rd, Swansea, MA 02777 and is currently estimated at $492,602, approximately $350 per square foot. 35 Hornbine Rd is a home located in Bristol County with nearby schools including Joseph Case High School, Swansea Wood School, and SCEC Life Academy.
Ownership History
Date
Name
Owned For
Owner Type
Purchase Details
Closed on
Jul 22, 2014
Sold by
Winiarski Ronald P and Winiarski Maria F
Bought by
Winiarski Irt
Current Estimated Value
Purchase Details
Closed on
Oct 1, 1990
Sold by
Darcy James A
Bought by
Winiarski Ronald P
Home Financials for this Owner
Home Financials are based on the most recent Mortgage that was taken out on this home.
Original Mortgage
$146,300
Interest Rate
9.95%
Mortgage Type
Purchase Money Mortgage
Purchase Details
Closed on
Oct 10, 1989
Sold by
Ohern Rt Patricia
Bought by
Monkowski Richard
Home Financials for this Owner
Home Financials are based on the most recent Mortgage that was taken out on this home.
Original Mortgage
$128,900
Interest Rate
10.12%
Mortgage Type
Purchase Money Mortgage
Purchase Details
Closed on
Jul 22, 1988
Sold by
Custer Roberrt L
Bought by
Law Julia A
Create a Home Valuation Report for This Property
The Home Valuation Report is an in-depth analysis detailing your home's value as well as a comparison with similar homes in the area
Home Values in the Area
Average Home Value in this Area
Purchase History
| Date | Buyer | Sale Price | Title Company |
|---|---|---|---|
| Winiarski Irt | -- | -- | |
| Monkowski Richard | $171,900 | -- | |
| Law Julia A | $165,000 | -- | |
| Winiarski Ronald P | $154,000 | -- |
Source: Public Records
Mortgage History
| Date | Status | Borrower | Loan Amount |
|---|---|---|---|
| Previous Owner | Law Julia A | $85,000 | |
| Previous Owner | Law Julia A | $141,550 | |
| Previous Owner | Law Julia A | $146,300 | |
| Previous Owner | Law Julia A | $128,900 |
Source: Public Records
Tax History Compared to Growth
Tax History
| Year | Tax Paid | Tax Assessment Tax Assessment Total Assessment is a certain percentage of the fair market value that is determined by local assessors to be the total taxable value of land and additions on the property. | Land | Improvement |
|---|---|---|---|---|
| 2025 | $5,269 | $442,000 | $176,000 | $266,000 |
| 2024 | $5,240 | $437,000 | $176,000 | $261,000 |
| 2023 | $5,396 | $411,000 | $129,000 | $282,000 |
| 2022 | $5,183 | $360,200 | $117,300 | $242,900 |
| 2021 | $4,759 | $304,500 | $117,300 | $187,200 |
| 2020 | $3,898 | $250,200 | $117,300 | $132,900 |
| 2019 | $3,639 | $234,600 | $104,700 | $129,900 |
| 2018 | $3,559 | $232,900 | $103,000 | $129,900 |
| 2017 | $3,171 | $238,800 | $103,000 | $135,800 |
| 2016 | $2,893 | $214,000 | $88,700 | $125,300 |
| 2015 | $2,700 | $205,600 | $88,700 | $116,900 |
| 2014 | $2,601 | $202,600 | $88,700 | $113,900 |
Source: Public Records
Map
Nearby Homes
- 0 Hornbine Rd
- 203 Hornbine Rd
- 850 Hortonville Rd
- 0B Cummings Rd
- 0A Cummings Rd
- 51 Sophia Dr
- 50 Sophia Dr
- 49 Sophia Dr
- 490 Dillon Ln
- 47 Spring St
- 4 Meadowbrook Ave
- 16 Ashlynn Way
- 283 Plain St
- 16 Martin St
- Lot 11 Lynch
- 0 Proprietors Way Unit 73324662
- Lot 10 Lynch
- 194 Hortonville Rd
- 48 Laurie Ln
- 7 Johnnies Way