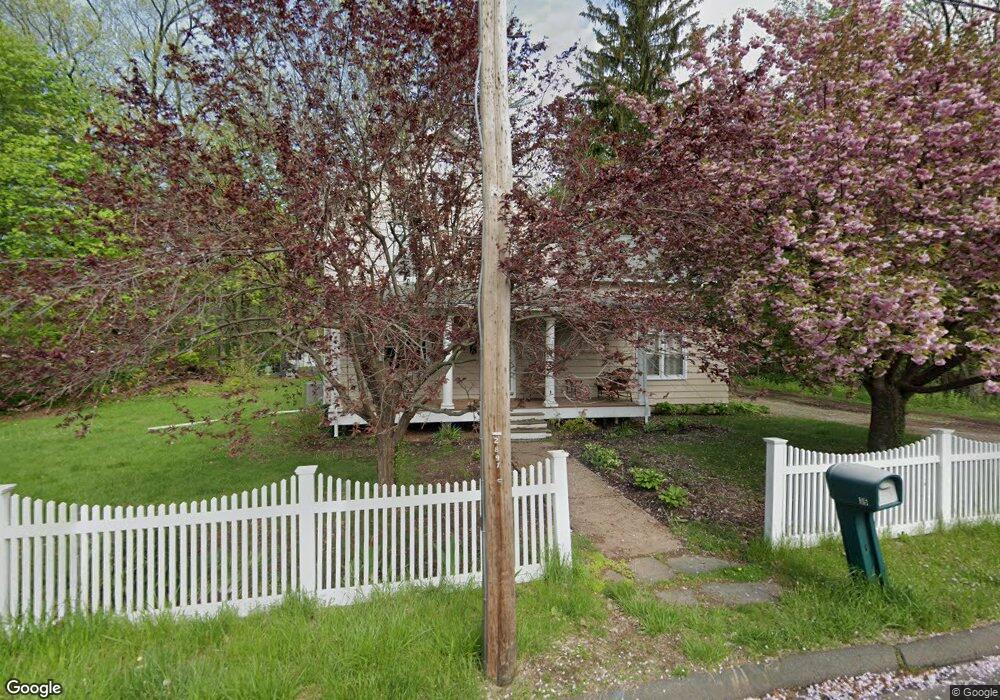
35 Horton Ave Cheshire, CT 06410
Estimated Value: $503,000 - $590,000
4
Beds
7
Baths
2,338
Sq Ft
$233/Sq Ft
Est. Value
About This Home
This home is located at 35 Horton Ave, Cheshire, CT 06410 and is currently estimated at $545,747, approximately $233 per square foot. 35 Horton Ave is a home located in New Haven County with nearby schools including Darcey School, Doolittle School, and Dodd Middle School.
Ownership History
Date
Name
Owned For
Owner Type
Purchase Details
Closed on
Feb 18, 2025
Sold by
Pelkey Arthur V
Bought by
Pelkey Maris K
Current Estimated Value
Home Financials for this Owner
Home Financials are based on the most recent Mortgage that was taken out on this home.
Original Mortgage
$292,150
Outstanding Balance
$290,421
Interest Rate
6.93%
Mortgage Type
Purchase Money Mortgage
Estimated Equity
$255,326
Purchase Details
Closed on
May 1, 2009
Sold by
Roche John A and Roche Barbara M
Bought by
Pelkey Arthur and Pelkey Maris K F
Home Financials for this Owner
Home Financials are based on the most recent Mortgage that was taken out on this home.
Original Mortgage
$274,928
Interest Rate
4.86%
Purchase Details
Closed on
May 3, 1989
Sold by
Miller Selden
Bought by
Roche John
Create a Home Valuation Report for This Property
The Home Valuation Report is an in-depth analysis detailing your home's value as well as a comparison with similar homes in the area
Home Values in the Area
Average Home Value in this Area
Purchase History
| Date | Buyer | Sale Price | Title Company |
|---|---|---|---|
| Pelkey Maris K | $80,750 | None Available | |
| Pelkey Maris K | $80,750 | None Available | |
| Pelkey Arthur | $280,000 | -- | |
| Pelkey Arthur V | $280,000 | -- | |
| Roche John | $171,000 | -- |
Source: Public Records
Mortgage History
| Date | Status | Borrower | Loan Amount |
|---|---|---|---|
| Open | Pelkey Maris K | $292,150 | |
| Closed | Pelkey Maris K | $292,150 | |
| Previous Owner | Roche John | $272,751 | |
| Previous Owner | Roche John | $274,928 |
Source: Public Records
Tax History Compared to Growth
Tax History
| Year | Tax Paid | Tax Assessment Tax Assessment Total Assessment is a certain percentage of the fair market value that is determined by local assessors to be the total taxable value of land and additions on the property. | Land | Improvement |
|---|---|---|---|---|
| 2025 | $7,832 | $263,340 | $59,570 | $203,770 |
| 2024 | $7,231 | $263,340 | $59,570 | $203,770 |
| 2023 | $6,348 | $180,910 | $59,570 | $121,340 |
| 2022 | $6,209 | $180,910 | $59,570 | $121,340 |
| 2021 | $6,100 | $180,910 | $59,570 | $121,340 |
| 2020 | $6,010 | $180,910 | $59,570 | $121,340 |
| 2019 | $6,010 | $180,910 | $59,570 | $121,340 |
| 2018 | $5,785 | $177,330 | $59,890 | $117,440 |
| 2017 | $5,664 | $177,330 | $59,890 | $117,440 |
| 2016 | $5,442 | $177,330 | $59,890 | $117,440 |
| 2015 | $5,442 | $177,330 | $59,890 | $117,440 |
| 2014 | $5,364 | $177,330 | $59,890 | $117,440 |
Source: Public Records
Map
Nearby Homes
- 167 Spring St
- 130 Edwards Rd
- 6 Melrose Dr Unit Lot 10
- 9 Melrose Dr Unit 6
- 8 Melrose Dr
- 23 Melrose Dr
- 471 E Mitchell Ave
- 112 Laurel Terrace
- 70 Warren St
- 160 Willow St
- 3 Melrose Dr Unit Lot 9
- 435 Maple Ave
- 16 Deepwood Dr
- 634 Cornwall Ave
- 21 Melrose Dr Unit Lot 2
- 37 Ives Hill Ct
- 17 Melrose Dr Unit Lot 3
- 30 Elmwood Dr
- 278 Wiese Rd
- 4 Blueberry Place