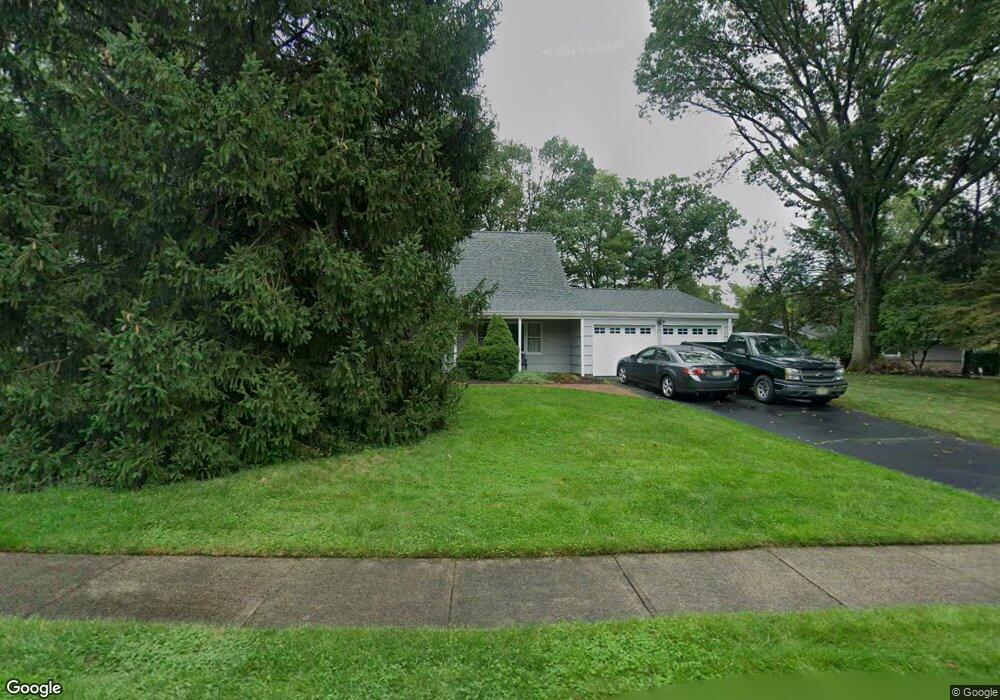
35 Hughes Rd Somerset, NJ 08873
Estimated Value: $557,897 - $674,000
--
Bed
--
Bath
1,959
Sq Ft
$311/Sq Ft
Est. Value
About This Home
This home is located at 35 Hughes Rd, Somerset, NJ 08873 and is currently estimated at $608,974, approximately $310 per square foot. 35 Hughes Rd is a home located in Somerset County with nearby schools including Franklin High School, Cedar Hill Preparatory School, and Rutgers Preparatory School.
Ownership History
Date
Name
Owned For
Owner Type
Purchase Details
Closed on
Aug 24, 2016
Sold by
Olney Donald H and Olney Mary Grace
Bought by
Olney Donald H
Current Estimated Value
Purchase Details
Closed on
Mar 22, 2005
Sold by
Hopkins David C
Bought by
Olney Donald H and Olney Mary Grace
Home Financials for this Owner
Home Financials are based on the most recent Mortgage that was taken out on this home.
Original Mortgage
$365,760
Outstanding Balance
$186,535
Interest Rate
5.7%
Mortgage Type
New Conventional
Estimated Equity
$422,439
Purchase Details
Closed on
Jul 7, 1998
Sold by
Gray Kevin
Bought by
Hopkins David and Hopkins Evelyne
Home Financials for this Owner
Home Financials are based on the most recent Mortgage that was taken out on this home.
Original Mortgage
$164,000
Interest Rate
6.98%
Purchase Details
Closed on
Dec 27, 1988
Sold by
Gray Kevin J and Gray Susan M
Bought by
Gray Kevin J
Create a Home Valuation Report for This Property
The Home Valuation Report is an in-depth analysis detailing your home's value as well as a comparison with similar homes in the area
Home Values in the Area
Average Home Value in this Area
Purchase History
| Date | Buyer | Sale Price | Title Company |
|---|---|---|---|
| Olney Donald H | -- | None Available | |
| Olney Donald H | $373,000 | -- | |
| Olney Donald H | $373,000 | Stewart Title Guaranty Co | |
| Hopkins David | $182,000 | -- | |
| Gray Kevin J | -- | -- |
Source: Public Records
Mortgage History
| Date | Status | Borrower | Loan Amount |
|---|---|---|---|
| Open | Olney Donald H | $365,760 | |
| Closed | Olney Donald H | $335,700 | |
| Previous Owner | Hopkins David | $164,000 |
Source: Public Records
Tax History Compared to Growth
Tax History
| Year | Tax Paid | Tax Assessment Tax Assessment Total Assessment is a certain percentage of the fair market value that is determined by local assessors to be the total taxable value of land and additions on the property. | Land | Improvement |
|---|---|---|---|---|
| 2025 | $8,985 | $519,100 | $331,300 | $187,800 |
| 2024 | $8,985 | $494,200 | $365,700 | $128,500 |
| 2023 | $8,578 | $444,200 | $315,700 | $128,500 |
| 2022 | $7,830 | $384,200 | $255,700 | $128,500 |
| 2021 | $7,403 | $334,200 | $205,700 | $128,500 |
| 2020 | $7,113 | $314,200 | $185,700 | $128,500 |
| 2019 | $7,233 | $314,200 | $185,700 | $128,500 |
| 2018 | $6,727 | $289,200 | $160,700 | $128,500 |
| 2017 | $6,400 | $274,200 | $145,700 | $128,500 |
| 2016 | $6,211 | $264,200 | $135,700 | $128,500 |
| 2015 | $6,403 | $274,200 | $145,700 | $128,500 |
| 2014 | $6,197 | $269,200 | $140,700 | $128,500 |
Source: Public Records
Map
Nearby Homes