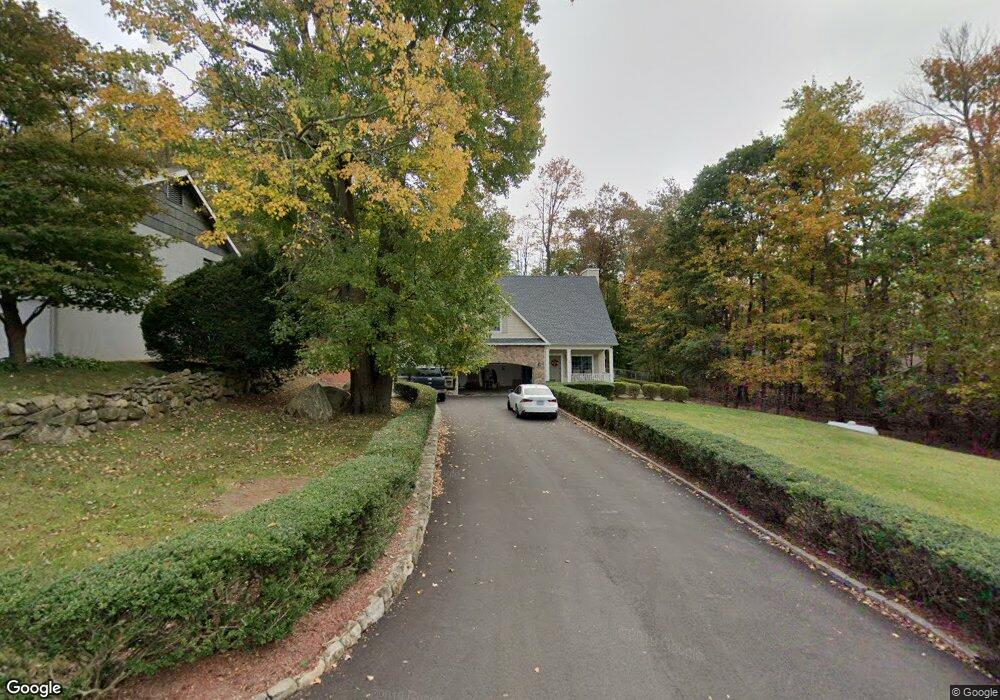
35 Ilion Rd New Fairfield, CT 06812
Estimated Value: $522,000 - $646,000
3
Beds
4
Baths
1,913
Sq Ft
$307/Sq Ft
Est. Value
About This Home
This home is located at 35 Ilion Rd, New Fairfield, CT 06812 and is currently estimated at $587,262, approximately $306 per square foot. 35 Ilion Rd is a home located in Fairfield County with nearby schools including Meeting House Hill School, New Fairfield Middle School, and New Fairfield High School.
Ownership History
Date
Name
Owned For
Owner Type
Purchase Details
Closed on
Nov 8, 2002
Sold by
Bella Vin Dev Llc
Bought by
Vasquez Vladimir and Hernandez Aracelis I
Current Estimated Value
Home Financials for this Owner
Home Financials are based on the most recent Mortgage that was taken out on this home.
Original Mortgage
$290,000
Interest Rate
6.04%
Purchase Details
Closed on
Jul 24, 2001
Sold by
Gorman Vincnet A
Bought by
Bella Vin Dev Llc
Purchase Details
Closed on
Apr 28, 1990
Sold by
Chin David C Y
Bought by
Difabio Massimo
Home Financials for this Owner
Home Financials are based on the most recent Mortgage that was taken out on this home.
Original Mortgage
$130,000
Interest Rate
10.26%
Create a Home Valuation Report for This Property
The Home Valuation Report is an in-depth analysis detailing your home's value as well as a comparison with similar homes in the area
Home Values in the Area
Average Home Value in this Area
Purchase History
| Date | Buyer | Sale Price | Title Company |
|---|---|---|---|
| Vasquez Vladimir | $332,900 | -- | |
| Bella Vin Dev Llc | $60,000 | -- | |
| Difabio Massimo | $151,000 | -- |
Source: Public Records
Mortgage History
| Date | Status | Borrower | Loan Amount |
|---|---|---|---|
| Open | Difabio Massimo | $376,000 | |
| Closed | Difabio Massimo | $387,100 | |
| Closed | Difabio Massimo | $290,000 | |
| Previous Owner | Difabio Massimo | $130,000 |
Source: Public Records
Tax History
| Year | Tax Paid | Tax Assessment Tax Assessment Total Assessment is a certain percentage of the fair market value that is determined by local assessors to be the total taxable value of land and additions on the property. | Land | Improvement |
|---|---|---|---|---|
| 2025 | $9,674 | $367,400 | $103,100 | $264,300 |
| 2024 | $9,426 | $258,100 | $96,000 | $162,100 |
| 2023 | $9,008 | $258,100 | $96,000 | $162,100 |
| 2022 | $8,381 | $258,100 | $96,000 | $162,100 |
| 2021 | $8,128 | $258,100 | $96,000 | $162,100 |
| 2020 | $7,893 | $258,100 | $96,000 | $162,100 |
| 2019 | $7,360 | $238,200 | $78,400 | $159,800 |
| 2018 | $7,284 | $238,200 | $78,400 | $159,800 |
| 2017 | $6,930 | $232,400 | $78,400 | $154,000 |
| 2016 | $6,665 | $232,400 | $78,400 | $154,000 |
| 2015 | $6,665 | $232,400 | $78,400 | $154,000 |
| 2014 | $6,671 | $255,800 | $85,500 | $170,300 |
Source: Public Records
Map
Nearby Homes
Your Personal Tour Guide
Ask me questions while you tour the home.