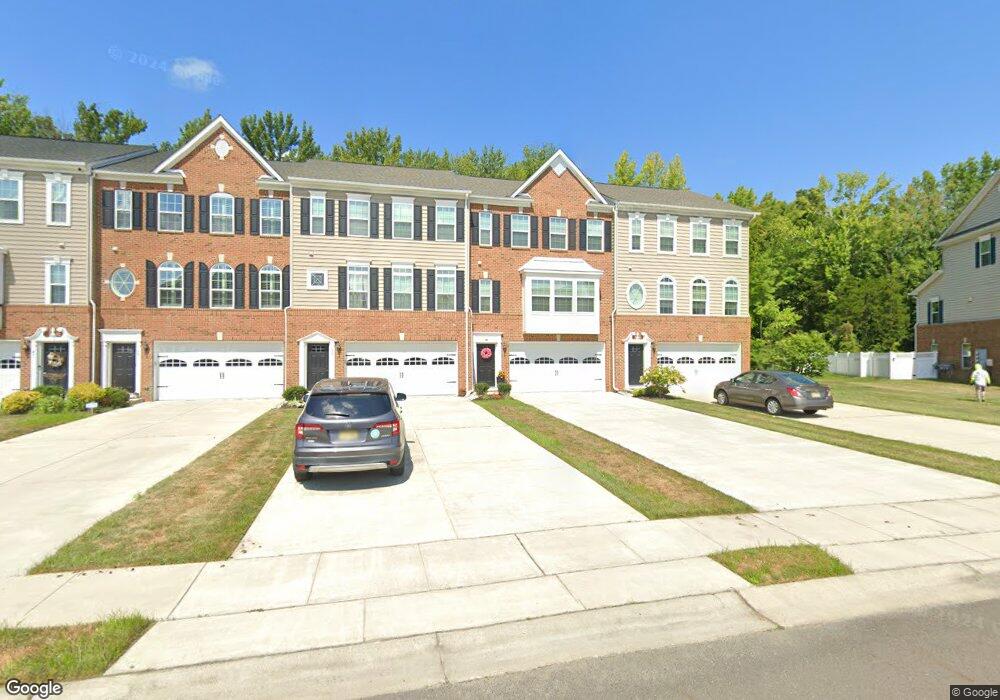
35 Isabelle Ct Marlton, NJ 08053
Estimated Value: $587,000 - $612,000
--
Bed
--
Bath
2,676
Sq Ft
$224/Sq Ft
Est. Value
About This Home
This home is located at 35 Isabelle Ct, Marlton, NJ 08053 and is currently estimated at $598,734, approximately $223 per square foot. 35 Isabelle Ct is a home with nearby schools including H.L. Beeler Elementary School, Frances Demasi Middle School, and Lenape High School.
Ownership History
Date
Name
Owned For
Owner Type
Purchase Details
Closed on
Oct 20, 2015
Sold by
Nvr Inc
Bought by
Henry Floyd Horace
Current Estimated Value
Home Financials for this Owner
Home Financials are based on the most recent Mortgage that was taken out on this home.
Original Mortgage
$371,072
Outstanding Balance
$291,956
Interest Rate
3.88%
Mortgage Type
VA
Estimated Equity
$306,778
Purchase Details
Closed on
Jul 30, 2015
Sold by
Mi Pro Homes Llc
Bought by
Nvr Inc and Ryan Homes
Home Financials for this Owner
Home Financials are based on the most recent Mortgage that was taken out on this home.
Interest Rate
3.98%
Create a Home Valuation Report for This Property
The Home Valuation Report is an in-depth analysis detailing your home's value as well as a comparison with similar homes in the area
Home Values in the Area
Average Home Value in this Area
Purchase History
| Date | Buyer | Sale Price | Title Company |
|---|---|---|---|
| Henry Floyd Horace | $363,262 | Legacy Title Agency | |
| Nvr Inc | $100,000 | -- |
Source: Public Records
Mortgage History
| Date | Status | Borrower | Loan Amount |
|---|---|---|---|
| Open | Henry Floyd Horace | $371,072 | |
| Previous Owner | Nvr Inc | -- |
Source: Public Records
Tax History Compared to Growth
Tax History
| Year | Tax Paid | Tax Assessment Tax Assessment Total Assessment is a certain percentage of the fair market value that is determined by local assessors to be the total taxable value of land and additions on the property. | Land | Improvement |
|---|---|---|---|---|
| 2025 | $12,226 | $358,000 | $73,000 | $285,000 |
| 2024 | $11,503 | $358,000 | $73,000 | $285,000 |
| 2023 | $11,503 | $358,000 | $73,000 | $285,000 |
| 2022 | $10,987 | $358,000 | $73,000 | $285,000 |
| 2021 | $9,812 | $358,000 | $73,000 | $285,000 |
| 2020 | $10,590 | $358,000 | $73,000 | $285,000 |
| 2019 | $10,504 | $358,000 | $73,000 | $285,000 |
| 2018 | $10,357 | $358,000 | $73,000 | $285,000 |
| 2017 | $10,235 | $358,000 | $73,000 | $285,000 |
| 2016 | $2,036 | $73,000 | $73,000 | $0 |
| 2015 | $2,000 | $73,000 | $73,000 | $0 |
| 2014 | $932 | $35,000 | $35,000 | $0 |
Source: Public Records
Map
Nearby Homes
- 48 Keegan Ct
- 6 Bluff Ct
- 112 Preakness Dr
- 101 Church Rd
- 426 Pimlico Way
- 304 Hialeah Dr
- 8 Jonquil Place
- 174 Greenbrook Dr
- 23 Lavender Ct
- 16 Hibiscus Dr
- 21 Woodthrush Ct
- 6205 Baltimore Dr Unit 6205
- 1604 Delancey Way Unit 1604
- 56 Weaver Dr
- 294 Hartford Rd
- 108 Weaver Dr
- 272 Hartford Rd
- 1107 Squirrel Rd
- 5 Hilltop Dr
- 29 Longhurst Rd