
Seller's Agent in 2024
The Movement Group
Compass
(781) 854-1624
5 in this area
333 Total Sales
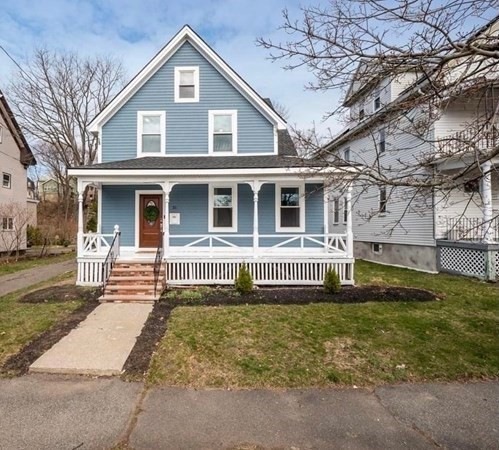
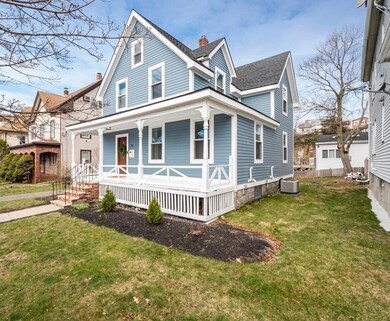
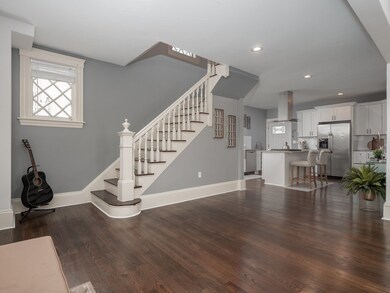
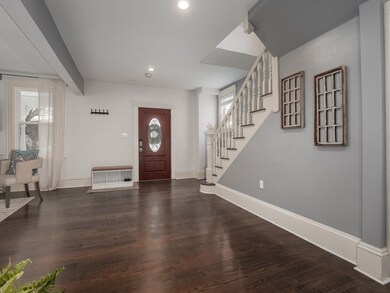
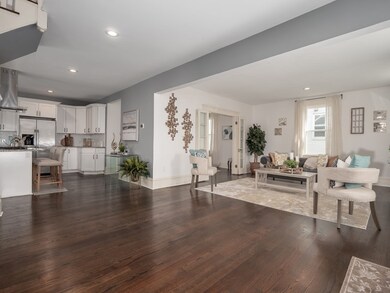
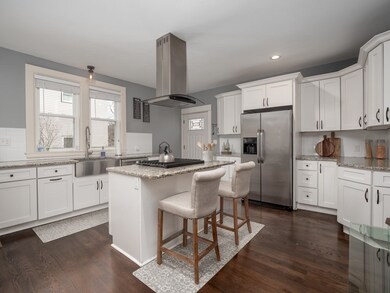
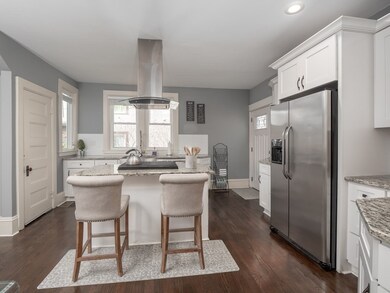
This beautiful Single Family Home has been masterfully renovated and sits in the desirable Cliftondale neighborhood of Saugus. From the porch and entryway you'll notice the stunning Open Concept and spacious Layout throughout, offering smart living space perfect for entertaining! A beautiful 3 Bed, 2.5 Bath Colonial conveniently located with close proximity to downtown & easy access to Rt 1. Living Room, Dining Room, a Chef's Kitchen featuring a cook-in Island, Granite Counters and Stainless Steel Appliances, gorgeous hardwood floors throughout on First Floor. Second Floor offers your own Master Bedroom, a master suite with custom tiled walk-in shower, 2nd and 3rd bedrooms and a full bathroom with a vintage clawfoot tub. Updates includes: Everlast Composite Siding, new Roof, new Hardwood Floors on the 1st floor and much more. OH Saturday 12-2pm and Sunday 12-2pm.
Last Agent to Sell the Property
The Neighborhood Realty Group Listed on: 04/08/2021
| Date | Type | Sale Price | Title Company |
|---|---|---|---|
| Deed | $330,000 | -- | |
| Deed | -- | -- | |
| Deed | -- | -- |
| Date | Event | Price | Change | Sq Ft Price |
|---|---|---|---|---|
| 01/02/2024 01/02/24 | Sold | $699,000 | +2.0% | $398 / Sq Ft |
| 12/12/2023 12/12/23 | Pending | -- | -- | -- |
| 11/16/2023 11/16/23 | Price Changed | $684,999 | -0.6% | $390 / Sq Ft |
| 11/08/2023 11/08/23 | Price Changed | $689,000 | -1.4% | $392 / Sq Ft |
| 10/18/2023 10/18/23 | For Sale | $699,000 | +13.7% | $398 / Sq Ft |
| 05/17/2021 05/17/21 | Sold | $615,000 | +4.4% | $350 / Sq Ft |
| 04/15/2021 04/15/21 | Pending | -- | -- | -- |
| 04/08/2021 04/08/21 | For Sale | $589,000 | +31.8% | $335 / Sq Ft |
| 09/07/2017 09/07/17 | Sold | $447,000 | -0.6% | $255 / Sq Ft |
| 07/18/2017 07/18/17 | Pending | -- | -- | -- |
| 07/13/2017 07/13/17 | Price Changed | $449,900 | -4.3% | $256 / Sq Ft |
| 06/22/2017 06/22/17 | For Sale | $469,900 | +42.4% | $268 / Sq Ft |
| 03/21/2017 03/21/17 | Sold | $330,000 | +10.4% | $188 / Sq Ft |
| 03/08/2017 03/08/17 | Pending | -- | -- | -- |
| 02/26/2017 02/26/17 | For Sale | $299,000 | -- | $170 / Sq Ft |
| Year | Tax Paid | Tax Assessment Tax Assessment Total Assessment is a certain percentage of the fair market value that is determined by local assessors to be the total taxable value of land and additions on the property. | Land | Improvement |
|---|---|---|---|---|
| 2025 | $6,452 | $604,100 | $301,000 | $303,100 |
| 2024 | $6,191 | $581,300 | $283,800 | $297,500 |
| 2023 | $5,765 | $512,000 | $249,400 | $262,600 |
| 2022 | $5,418 | $451,100 | $228,800 | $222,300 |
| 2021 | $4,998 | $405,000 | $198,700 | $206,300 |
| 2020 | $4,623 | $387,800 | $189,200 | $198,600 |
| 2019 | $4,544 | $373,100 | $172,000 | $201,100 |
| 2018 | $4,134 | $357,000 | $166,800 | $190,200 |
| 2017 | $3,660 | $303,700 | $155,700 | $148,000 |
| 2016 | $3,353 | $274,800 | $155,400 | $119,400 |
| 2015 | $3,146 | $261,700 | $148,000 | $113,700 |
| 2014 | $3,142 | $270,600 | $148,000 | $122,600 |
Seller's Agent in 2024
The Movement Group
Compass
(781) 854-1624
5 in this area
333 Total Sales
Seller Co-Listing Agent in 2024
Torin Hanlon
Compass
(781) 307-6304
2 in this area
36 Total Sales
T
Buyer's Agent in 2024
The Dinan Team
Coldwell Banker Realty - Weston
(617) 699-3407
1 in this area
36 Total Sales
Seller's Agent in 2021
Darcilane Oliveira
The Neighborhood Realty Group
2 in this area
86 Total Sales
Buyer's Agent in 2021
Timothy Borders
Coldwell Banker Realty - Lynnfield
(781) 706-1690
2 in this area
28 Total Sales
Seller's Agent in 2017
Michelle Doherty
William Raveis R.E. & Home Services
(978) 204-0609
6 Total Sales
Source: MLS Property Information Network (MLS PIN)
MLS Number: 72811358
APN: SAUG-000005E-000016-000010
Disclaimer: Certain information contained herein is derived from information provided by parties other than Homes.com. All information provided is deemed reliable, but is not guaranteed to be accurate and should be independently verified.
![]() The property listing data and information, or the Images, set forth herein were provided to MLS Property Information Network, Inc. from third party sources, including sellers, lessors and public records, and were compiled by MLS Property Information Network, Inc. The property listing data and information, and the Images, are for the personal, non-commercial use of consumers having a good faith interest in purchasing or leasing listed properties of the type displayed to them and may not be used for any purpose other than to identify prospective properties which such consumers may have a good faith interest in purchasing or leasing. MLS Property Information Network, Inc. and its subscribers disclaim any and all representations and warranties as to the accuracy of the property listing data and information, or as to the accuracy of any of the Images, set forth herein.
The property listing data and information, or the Images, set forth herein were provided to MLS Property Information Network, Inc. from third party sources, including sellers, lessors and public records, and were compiled by MLS Property Information Network, Inc. The property listing data and information, and the Images, are for the personal, non-commercial use of consumers having a good faith interest in purchasing or leasing listed properties of the type displayed to them and may not be used for any purpose other than to identify prospective properties which such consumers may have a good faith interest in purchasing or leasing. MLS Property Information Network, Inc. and its subscribers disclaim any and all representations and warranties as to the accuracy of the property listing data and information, or as to the accuracy of any of the Images, set forth herein.