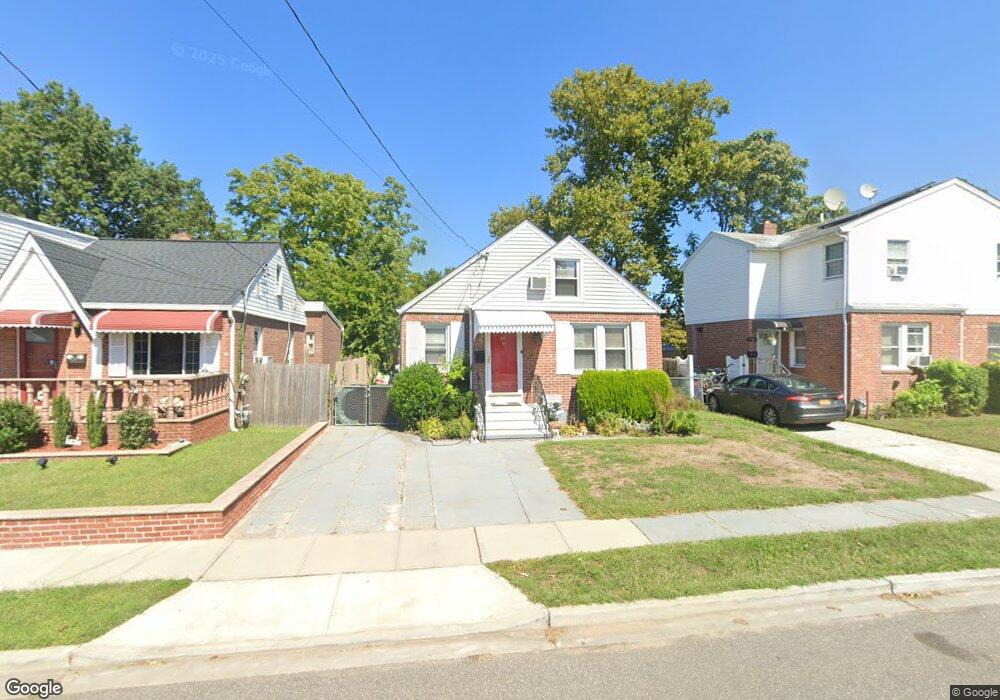
35 Jefferson Ave Valley Stream, NY 11580
Estimated Value: $637,000 - $685,790
4
Beds
2
Baths
1,075
Sq Ft
$615/Sq Ft
Est. Value
About This Home
This home is located at 35 Jefferson Ave, Valley Stream, NY 11580 and is currently estimated at $661,395, approximately $615 per square foot. 35 Jefferson Ave is a home located in Nassau County with nearby schools including Mona Prep and Bible Baptist Academy.
Ownership History
Date
Name
Owned For
Owner Type
Purchase Details
Closed on
Nov 22, 2017
Sold by
Vs Power Homes 1 Iric
Bought by
Conanan Amado
Current Estimated Value
Home Financials for this Owner
Home Financials are based on the most recent Mortgage that was taken out on this home.
Original Mortgage
$350,200
Outstanding Balance
$294,146
Interest Rate
3.94%
Mortgage Type
New Conventional
Estimated Equity
$367,249
Purchase Details
Closed on
Mar 8, 2017
Sold by
Brandt Selwyn and Hicks Donna C
Bought by
Vs Power Homes 1 Inc
Home Financials for this Owner
Home Financials are based on the most recent Mortgage that was taken out on this home.
Original Mortgage
$224,000
Interest Rate
4.17%
Mortgage Type
Purchase Money Mortgage
Purchase Details
Closed on
Oct 26, 2006
Sold by
Mehrok Amandeep
Bought by
Brandt Selwyn
Purchase Details
Closed on
Jun 7, 2005
Sold by
Mehrok Amandeep
Purchase Details
Closed on
Apr 22, 2003
Sold by
Vitrano Angelina
Bought by
Mehrok Amandeep
Create a Home Valuation Report for This Property
The Home Valuation Report is an in-depth analysis detailing your home's value as well as a comparison with similar homes in the area
Home Values in the Area
Average Home Value in this Area
Purchase History
| Date | Buyer | Sale Price | Title Company |
|---|---|---|---|
| Conanan Amado | $412,000 | -- | |
| Vs Power Homes 1 Inc | $280,000 | The Judicial Title Insurance | |
| Brandt Selwyn | $396,550 | -- | |
| -- | -- | -- | |
| Mehrok Amandeep | $225,000 | -- |
Source: Public Records
Mortgage History
| Date | Status | Borrower | Loan Amount |
|---|---|---|---|
| Open | Conanan Amado | $350,200 | |
| Previous Owner | Vs Power Homes 1 Inc | $224,000 |
Source: Public Records
Tax History Compared to Growth
Tax History
| Year | Tax Paid | Tax Assessment Tax Assessment Total Assessment is a certain percentage of the fair market value that is determined by local assessors to be the total taxable value of land and additions on the property. | Land | Improvement |
|---|---|---|---|---|
| 2025 | $9,114 | $435 | $168 | $267 |
| 2024 | $1,744 | $435 | $168 | $267 |
| 2023 | $9,096 | $435 | $168 | $267 |
| 2022 | $9,096 | $435 | $168 | $267 |
| 2021 | $13,012 | $417 | $161 | $256 |
| 2020 | $9,136 | $645 | $374 | $271 |
| 2019 | $1,857 | $745 | $432 | $313 |
| 2018 | $1,777 | $745 | $0 | $0 |
| 2017 | $5,986 | $745 | $432 | $313 |
| 2016 | $7,687 | $745 | $432 | $313 |
| 2015 | $1,669 | $745 | $432 | $313 |
| 2014 | $1,669 | $745 | $432 | $313 |
| 2013 | $1,553 | $745 | $432 | $313 |
Source: Public Records
Map
Nearby Homes
- 11 Jefferson Ave
- 64 Ormonde Blvd
- 110 Roeckel Ave
- 63 Cumberland Place
- 20 Spring Garden St
- 35 Harvard St
- 5 Park Place
- 97 Arlington Ave
- 128-36 Hook Creek Blvd
- 128-35 Brookville Blvd
- 24016 128th Rd
- 132-29 Brookville Blvd
- 211 Ash St
- 73 Broadway
- 87 Sobro Ave
- 9 Waverly Place
- 99 Hunter Ave
- 51 Sobro Ave
- 204 Beech St
- 131- 44 Laurelton Pkwy Unit Lower
- 39 Jefferson Ave
- 31 Jefferson Ave
- 43 Jefferson Ave
- 27 Jefferson Ave
- 36 Garfield Ave
- 40 Garfield Ave
- 32 Garfield Ave
- 23 Jefferson Ave
- 47 Jefferson Ave
- 44 Garfield Ave
- 28 Garfield Ave
- 40 Jefferson Ave
- 24 Garfield Ave
- 48 Garfield Ave
- 19 Jefferson Ave
- 44 Jefferson Ave
- 51 Jefferson Ave
- 36 Jefferson Ave
- 48 Jefferson Ave
- 32 Jefferson Ave