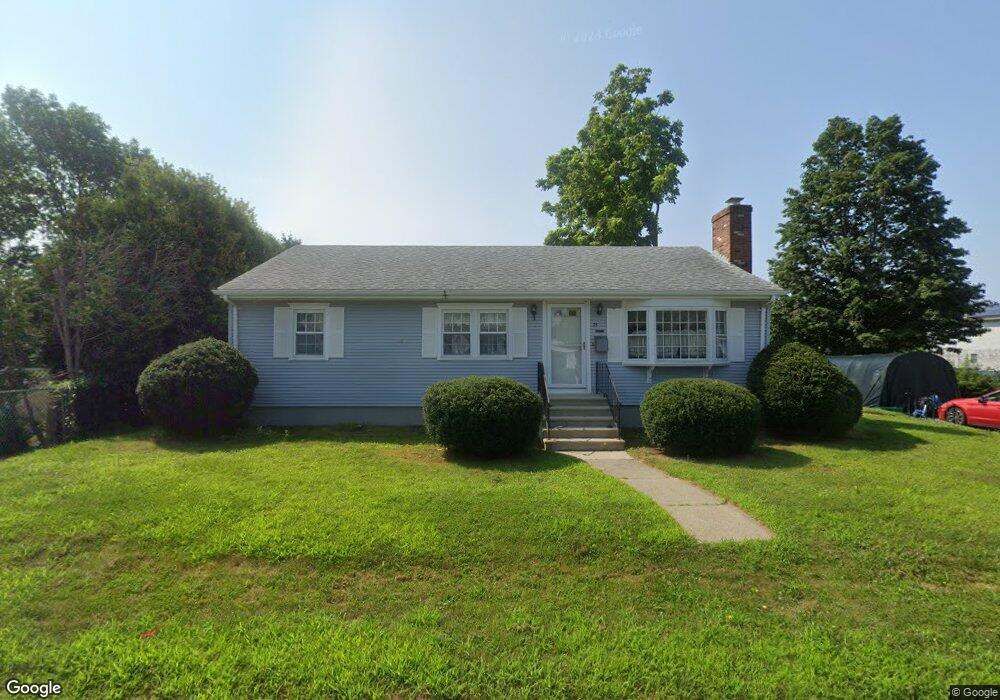
35 Jesse St Fairhaven, MA 02719
North Fairhaven NeighborhoodEstimated Value: $445,145 - $461,000
2
Beds
1
Bath
1,204
Sq Ft
$377/Sq Ft
Est. Value
About This Home
This home is located at 35 Jesse St, Fairhaven, MA 02719 and is currently estimated at $453,786, approximately $376 per square foot. 35 Jesse St is a home located in Bristol County with nearby schools including Fairhaven High School, Alma Del Mar Charter School, and St. Joseph School.
Ownership History
Date
Name
Owned For
Owner Type
Purchase Details
Closed on
Mar 27, 2024
Sold by
Garbetti Charles P and Garbetti Diane T
Bought by
Garbetti Charles P and Garbetti Diane I
Current Estimated Value
Purchase Details
Closed on
Jan 29, 2016
Sold by
William A Tremblay Ret and Ponte
Bought by
Garbetti Charles P and Garbetti Dianne I
Purchase Details
Closed on
May 6, 1991
Sold by
Athridge Robert M and Athridge Anita L
Bought by
Tremblay William A and Tremblay Jeannette
Home Financials for this Owner
Home Financials are based on the most recent Mortgage that was taken out on this home.
Original Mortgage
$45,000
Interest Rate
9.55%
Mortgage Type
Purchase Money Mortgage
Create a Home Valuation Report for This Property
The Home Valuation Report is an in-depth analysis detailing your home's value as well as a comparison with similar homes in the area
Home Values in the Area
Average Home Value in this Area
Purchase History
| Date | Buyer | Sale Price | Title Company |
|---|---|---|---|
| Garbetti Charles P | -- | None Available | |
| Garbetti Charles P | $107,500 | -- | |
| Tremblay William A | $115,000 | -- | |
| Tremblay William A | $115,000 | -- |
Source: Public Records
Mortgage History
| Date | Status | Borrower | Loan Amount |
|---|---|---|---|
| Previous Owner | Tremblay William A | $45,000 |
Source: Public Records
Tax History
| Year | Tax Paid | Tax Assessment Tax Assessment Total Assessment is a certain percentage of the fair market value that is determined by local assessors to be the total taxable value of land and additions on the property. | Land | Improvement |
|---|---|---|---|---|
| 2025 | $34 | $361,200 | $173,600 | $187,600 |
| 2024 | $3,112 | $337,200 | $173,600 | $163,600 |
| 2023 | $2,970 | $298,500 | $152,100 | $146,400 |
| 2022 | $2,804 | $274,400 | $141,300 | $133,100 |
| 2021 | $2,652 | $234,900 | $127,900 | $107,000 |
| 2020 | $4,185 | $234,900 | $127,900 | $107,000 |
| 2019 | $2,457 | $210,500 | $106,000 | $104,500 |
| 2018 | $2,355 | $200,400 | $100,900 | $99,500 |
| 2017 | $2,353 | $195,400 | $100,900 | $94,500 |
| 2016 | $2,318 | $190,300 | $100,900 | $89,400 |
| 2015 | $2,294 | $188,800 | $100,900 | $87,900 |
Source: Public Records
Map
Nearby Homes
Your Personal Tour Guide
Ask me questions while you tour the home.