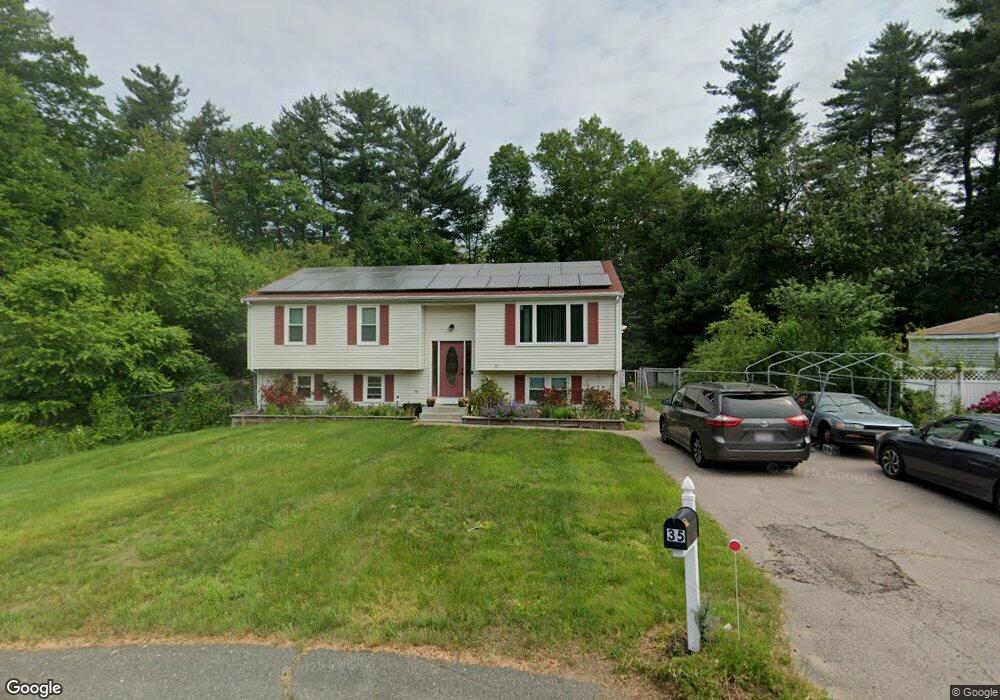
35 Keri Anne Dr Brockton, MA 02302
Estimated Value: $529,950 - $562,000
3
Beds
1
Bath
1,660
Sq Ft
$330/Sq Ft
Est. Value
About This Home
This home is located at 35 Keri Anne Dr, Brockton, MA 02302 and is currently estimated at $546,988, approximately $329 per square foot. 35 Keri Anne Dr is a home located in Plymouth County with nearby schools including Davis K-8 School, John F. Kennedy Elementary School, and South Middle School.
Ownership History
Date
Name
Owned For
Owner Type
Purchase Details
Closed on
Mar 30, 2005
Sold by
Fils-Aime Laurence and Fils-Aime Lucine
Bought by
Fils-Aime Georges and Fils-Aime Laurence
Current Estimated Value
Home Financials for this Owner
Home Financials are based on the most recent Mortgage that was taken out on this home.
Original Mortgage
$225,600
Outstanding Balance
$115,131
Interest Rate
5.61%
Mortgage Type
Purchase Money Mortgage
Estimated Equity
$431,857
Purchase Details
Closed on
Nov 18, 1994
Sold by
Cori Rt
Bought by
Martin Stephen J and Martin Paula D
Create a Home Valuation Report for This Property
The Home Valuation Report is an in-depth analysis detailing your home's value as well as a comparison with similar homes in the area
Home Values in the Area
Average Home Value in this Area
Purchase History
| Date | Buyer | Sale Price | Title Company |
|---|---|---|---|
| Fils-Aime Georges | -- | -- | |
| Martin Stephen J | $118,000 | -- |
Source: Public Records
Mortgage History
| Date | Status | Borrower | Loan Amount |
|---|---|---|---|
| Open | Martin Stephen J | $225,600 | |
| Previous Owner | Martin Stephen J | $51,000 | |
| Previous Owner | Martin Stephen J | $160,000 |
Source: Public Records
Tax History Compared to Growth
Tax History
| Year | Tax Paid | Tax Assessment Tax Assessment Total Assessment is a certain percentage of the fair market value that is determined by local assessors to be the total taxable value of land and additions on the property. | Land | Improvement |
|---|---|---|---|---|
| 2025 | $5,628 | $464,700 | $165,100 | $299,600 |
| 2024 | $5,582 | $464,400 | $165,100 | $299,300 |
| 2023 | $5,471 | $421,500 | $115,600 | $305,900 |
| 2022 | $5,022 | $359,500 | $105,100 | $254,400 |
| 2021 | $5,036 | $347,300 | $99,000 | $248,300 |
| 2020 | $4,889 | $322,700 | $86,300 | $236,400 |
| 2019 | $4,744 | $305,300 | $83,000 | $222,300 |
| 2018 | $4,545 | $283,000 | $83,000 | $200,000 |
| 2017 | $4,012 | $249,200 | $83,000 | $166,200 |
| 2016 | $4,227 | $243,500 | $79,100 | $164,400 |
| 2015 | $4,080 | $224,800 | $79,100 | $145,700 |
| 2014 | $3,744 | $206,500 | $79,100 | $127,400 |
Source: Public Records
Map
Nearby Homes