Estimated Value: $47,000 - $73,000
1
Bed
1
Bath
737
Sq Ft
$80/Sq Ft
Est. Value
About This Home
This home is located at 35 Keystone St, Ruth, NV 89319 and is currently estimated at $59,000, approximately $80 per square foot. 35 Keystone St is a home located in White Pine County with nearby schools including David E. Norman Elementary School, White Pine Middle School, and White Pine High School.
Ownership History
Date
Name
Owned For
Owner Type
Purchase Details
Closed on
Dec 20, 2024
Sold by
Oak Grove Properties Llc
Bought by
35 Keystone Llc
Current Estimated Value
Purchase Details
Closed on
Aug 29, 2024
Sold by
Lilly Jaime E and Lilly Jeremy F
Bought by
Lilly Jeremy F
Purchase Details
Closed on
Dec 20, 2022
Sold by
White Pine County
Bought by
Lilly Jeremy F
Purchase Details
Closed on
Jun 6, 2022
Sold by
White Pine County Treasurer
Bought by
White Pine County Treasurer
Purchase Details
Closed on
May 10, 2019
Sold by
White Pine County
Bought by
Lilly Jeremy F
Purchase Details
Closed on
Jun 4, 2018
Sold by
Johnston Dennis and Johnston Belinda
Bought by
White Pince County Treasurer and White Pine County Court House
Purchase Details
Closed on
Jun 4, 2012
Sold by
White Pine County
Bought by
Johnston Dennis and Johnston Belinda
Create a Home Valuation Report for This Property
The Home Valuation Report is an in-depth analysis detailing your home's value as well as a comparison with similar homes in the area
Purchase History
| Date | Buyer | Sale Price | Title Company |
|---|---|---|---|
| 35 Keystone Llc | -- | None Listed On Document | |
| Lilly Jeremy F | $35,250 | None Listed On Document | |
| Oak Grove Properties Llc | $35,250 | None Listed On Document | |
| Lilly Jeremy F | $35,250 | None Listed On Document | |
| Lilly Jeremy F | $15,191 | -- | |
| White Pine County Treasurer | $715 | None Listed On Document | |
| Lilly Jeremy F | $14,003 | None Available | |
| White Pince County Treasurer | $1,055 | None Available | |
| Johnston Dennis | $4,500 | -- |
Source: Public Records
Tax History
| Year | Tax Paid | Tax Assessment Tax Assessment Total Assessment is a certain percentage of the fair market value that is determined by local assessors to be the total taxable value of land and additions on the property. | Land | Improvement |
|---|---|---|---|---|
| 2025 | $227 | $12,236 | $2,382 | $9,854 |
| 2024 | $227 | $6,209 | $1,998 | $4,211 |
| 2023 | $227 | $5,784 | $1,998 | $3,786 |
| 2022 | $195 | $5,317 | $1,998 | $3,319 |
| 2021 | $183 | $5,012 | $1,947 | $3,065 |
| 2020 | $190 | $5,099 | $1,947 | $3,152 |
| 2019 | $179 | $4,901 | $1,947 | $2,954 |
| 2018 | $170 | $10,418 | $1,947 | $8,471 |
| 2017 | $156 | $3,292 | $1,947 | $1,345 |
| 2016 | $334 | $8,180 | $1,972 | $6,208 |
| 2015 | $485 | $8,273 | $2,126 | $6,147 |
| 2014 | $485 | $7,768 | $1,742 | $6,026 |
Source: Public Records
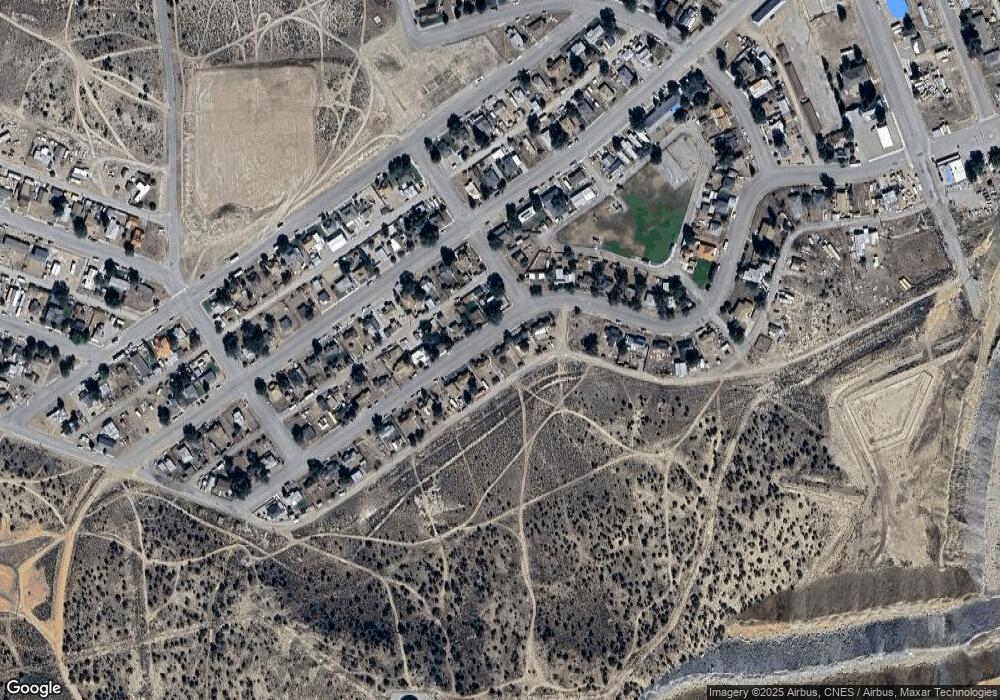
Map
Nearby Homes