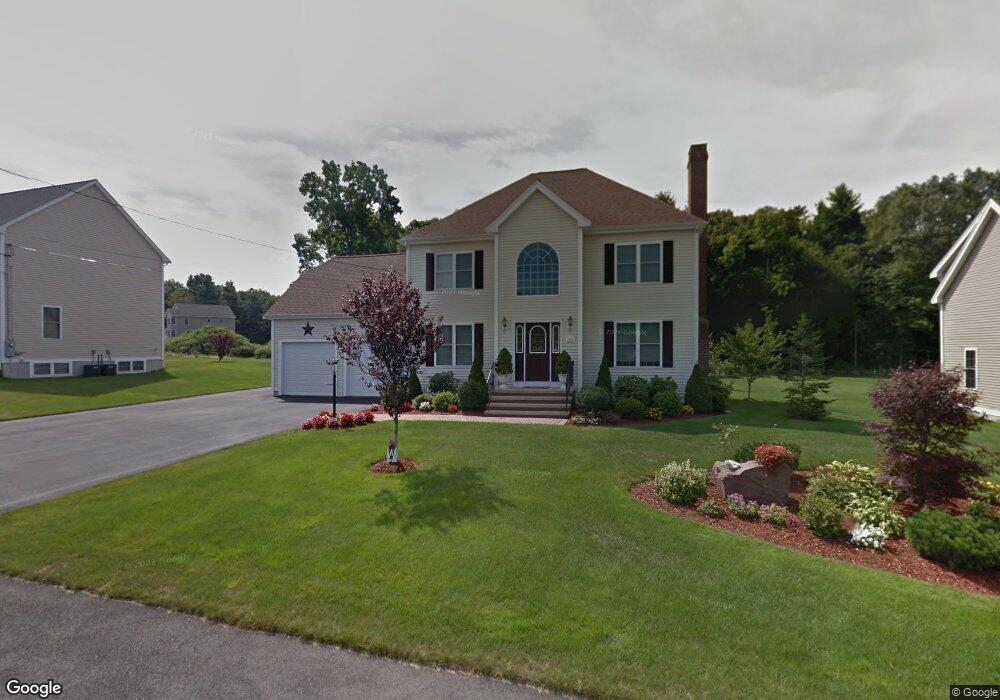
35 Laura Dr Attleboro, MA 02703
Estimated Value: $664,027 - $768,000
3
Beds
3
Baths
2,081
Sq Ft
$337/Sq Ft
Est. Value
About This Home
This home is located at 35 Laura Dr, Attleboro, MA 02703 and is currently estimated at $700,507, approximately $336 per square foot. 35 Laura Dr is a home located in Bristol County with nearby schools including Hill-Roberts Elementary School, Robert J. Coelho Middle School, and Attleboro High School.
Ownership History
Date
Name
Owned For
Owner Type
Purchase Details
Closed on
Apr 11, 2005
Sold by
Thornhill & Sons Llc
Bought by
Vieira Antonio F and Vieira Maria Gabriela
Current Estimated Value
Home Financials for this Owner
Home Financials are based on the most recent Mortgage that was taken out on this home.
Original Mortgage
$150,000
Outstanding Balance
$77,004
Interest Rate
5.7%
Mortgage Type
Purchase Money Mortgage
Estimated Equity
$623,503
Create a Home Valuation Report for This Property
The Home Valuation Report is an in-depth analysis detailing your home's value as well as a comparison with similar homes in the area
Home Values in the Area
Average Home Value in this Area
Purchase History
| Date | Buyer | Sale Price | Title Company |
|---|---|---|---|
| Vieira Antonio F | $405,900 | -- |
Source: Public Records
Mortgage History
| Date | Status | Borrower | Loan Amount |
|---|---|---|---|
| Open | Vieira Antonio F | $150,000 |
Source: Public Records
Tax History Compared to Growth
Tax History
| Year | Tax Paid | Tax Assessment Tax Assessment Total Assessment is a certain percentage of the fair market value that is determined by local assessors to be the total taxable value of land and additions on the property. | Land | Improvement |
|---|---|---|---|---|
| 2025 | $7,525 | $599,600 | $173,000 | $426,600 |
| 2024 | $7,106 | $558,200 | $155,700 | $402,500 |
| 2023 | $6,648 | $485,600 | $157,500 | $328,100 |
| 2022 | $6,351 | $439,500 | $150,100 | $289,400 |
| 2021 | $6,321 | $427,100 | $144,400 | $282,700 |
| 2020 | $6,019 | $413,400 | $137,600 | $275,800 |
| 2019 | $5,864 | $414,100 | $135,100 | $279,000 |
| 2018 | $5,658 | $381,800 | $131,200 | $250,600 |
| 2017 | $5,510 | $378,700 | $127,900 | $250,800 |
| 2016 | $5,331 | $359,700 | $119,400 | $240,300 |
| 2015 | $5,171 | $351,500 | $119,400 | $232,100 |
| 2014 | $5,097 | $343,200 | $114,100 | $229,100 |
Source: Public Records
Map
Nearby Homes