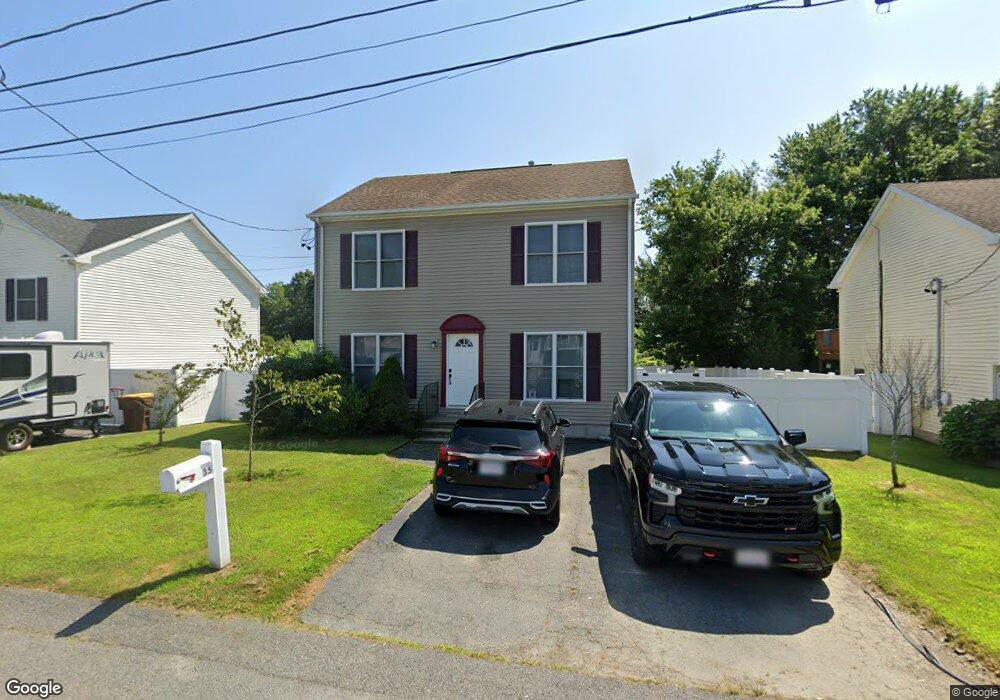
35 Lea Ln Fall River, MA 02721
Maplewood NeighborhoodEstimated Value: $485,042 - $567,000
3
Beds
2
Baths
2,268
Sq Ft
$227/Sq Ft
Est. Value
About This Home
This home is located at 35 Lea Ln, Fall River, MA 02721 and is currently estimated at $515,011, approximately $227 per square foot. 35 Lea Ln is a home located in Bristol County with nearby schools including Henry Lord Community School, B M C Durfee High School, and Argosy Collegiate Charter School.
Ownership History
Date
Name
Owned For
Owner Type
Purchase Details
Closed on
Jun 2, 2005
Sold by
Tilt A Whirl Rt
Bought by
Ozug Patricia L
Current Estimated Value
Home Financials for this Owner
Home Financials are based on the most recent Mortgage that was taken out on this home.
Original Mortgage
$80,000
Outstanding Balance
$41,953
Interest Rate
5.83%
Mortgage Type
Purchase Money Mortgage
Estimated Equity
$473,058
Create a Home Valuation Report for This Property
The Home Valuation Report is an in-depth analysis detailing your home's value as well as a comparison with similar homes in the area
Home Values in the Area
Average Home Value in this Area
Purchase History
| Date | Buyer | Sale Price | Title Company |
|---|---|---|---|
| Ozug Patricia L | $234,500 | -- |
Source: Public Records
Mortgage History
| Date | Status | Borrower | Loan Amount |
|---|---|---|---|
| Open | Ozug Patricia L | $80,000 |
Source: Public Records
Tax History
| Year | Tax Paid | Tax Assessment Tax Assessment Total Assessment is a certain percentage of the fair market value that is determined by local assessors to be the total taxable value of land and additions on the property. | Land | Improvement |
|---|---|---|---|---|
| 2025 | $4,398 | $384,100 | $116,300 | $267,800 |
| 2024 | $4,144 | $360,700 | $114,000 | $246,700 |
| 2023 | $4,151 | $338,300 | $102,700 | $235,600 |
| 2022 | $3,680 | $291,600 | $96,900 | $194,700 |
| 2021 | $3,477 | $251,400 | $92,600 | $158,800 |
| 2020 | $3,423 | $236,900 | $88,400 | $148,500 |
| 2019 | $3,422 | $234,700 | $92,300 | $142,400 |
| 2018 | $3,301 | $225,800 | $93,000 | $132,800 |
| 2017 | $2,978 | $212,700 | $93,000 | $119,700 |
| 2016 | $2,836 | $208,100 | $95,900 | $112,200 |
| 2015 | $2,867 | $219,200 | $95,900 | $123,300 |
| 2014 | $2,758 | $219,200 | $95,900 | $123,300 |
Source: Public Records
Map
Nearby Homes
Your Personal Tour Guide
Ask me questions while you tour the home.