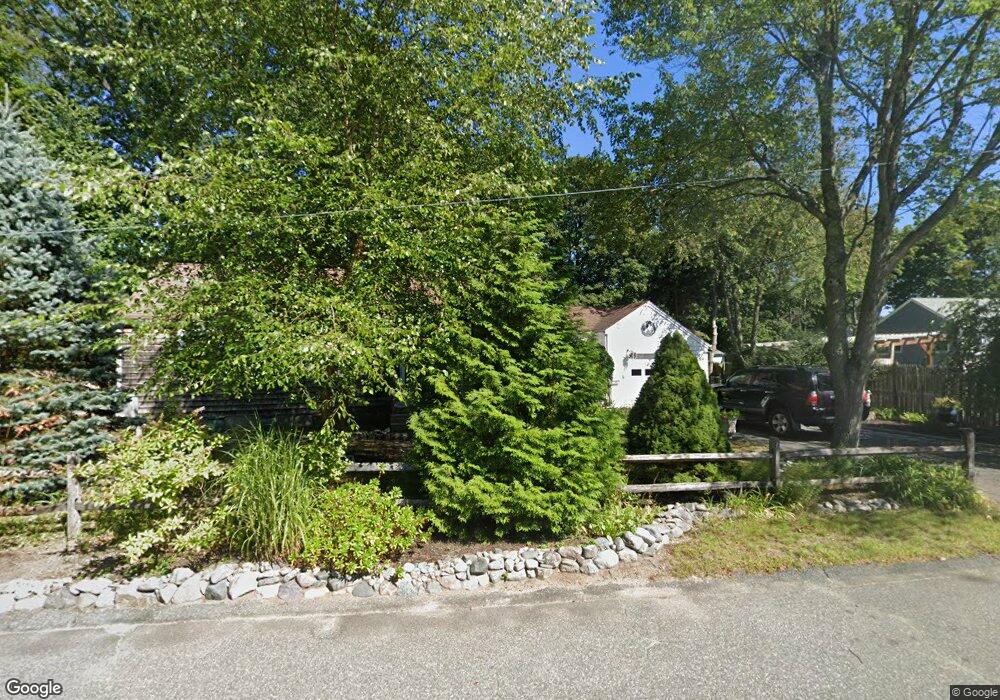
35 Leslie Ave Weymouth, MA 02188
East Weymouth NeighborhoodEstimated Value: $570,000 - $612,000
3
Beds
2
Baths
1,222
Sq Ft
$480/Sq Ft
Est. Value
About This Home
This home is located at 35 Leslie Ave, Weymouth, MA 02188 and is currently estimated at $586,202, approximately $479 per square foot. 35 Leslie Ave is a home located in Norfolk County with nearby schools including William Seach Elementary School, Abigail Adams Middle School, and Weymouth Middle School Chapman.
Ownership History
Date
Name
Owned For
Owner Type
Purchase Details
Closed on
Aug 29, 2003
Sold by
Hogue Katherine G
Bought by
Thomson David J and Mooney Kathy L
Current Estimated Value
Home Financials for this Owner
Home Financials are based on the most recent Mortgage that was taken out on this home.
Original Mortgage
$232,000
Outstanding Balance
$103,538
Interest Rate
5.69%
Mortgage Type
Purchase Money Mortgage
Estimated Equity
$482,664
Create a Home Valuation Report for This Property
The Home Valuation Report is an in-depth analysis detailing your home's value as well as a comparison with similar homes in the area
Home Values in the Area
Average Home Value in this Area
Purchase History
| Date | Buyer | Sale Price | Title Company |
|---|---|---|---|
| Thomson David J | $290,000 | -- |
Source: Public Records
Mortgage History
| Date | Status | Borrower | Loan Amount |
|---|---|---|---|
| Open | Thomson David J | $232,000 |
Source: Public Records
Tax History Compared to Growth
Tax History
| Year | Tax Paid | Tax Assessment Tax Assessment Total Assessment is a certain percentage of the fair market value that is determined by local assessors to be the total taxable value of land and additions on the property. | Land | Improvement |
|---|---|---|---|---|
| 2025 | $4,855 | $480,700 | $207,000 | $273,700 |
| 2024 | $4,703 | $457,900 | $197,100 | $260,800 |
| 2023 | $4,532 | $433,700 | $182,500 | $251,200 |
| 2022 | $4,616 | $402,800 | $185,900 | $216,900 |
| 2021 | $4,329 | $368,700 | $185,900 | $182,800 |
| 2020 | $4,167 | $349,600 | $185,900 | $163,700 |
| 2019 | $3,992 | $329,400 | $178,800 | $150,600 |
| 2018 | $3,931 | $314,500 | $170,200 | $144,300 |
| 2017 | $3,798 | $296,500 | $162,200 | $134,300 |
| 2016 | $3,649 | $285,100 | $155,900 | $129,200 |
| 2015 | $3,484 | $270,100 | $148,800 | $121,300 |
| 2014 | $3,397 | $255,400 | $138,500 | $116,900 |
Source: Public Records
Map
Nearby Homes
- 449 Middle St
- 42 Sundin Rd
- 303 Middle St
- 209 Lake St Unit 69
- 286 Essex St
- 12 Klasson Ln
- 215 Winter St Unit 1P
- 286 Broad St
- 747 Middle St
- 33 Congress St
- 29-31 Broad Street Place
- 367 Essex St
- 575 Broad St Unit 305
- 575 Broad St Unit 215
- 573 Broad St Unit 234
- 54 Federal St
- 966 Washington St Unit 2
- 24 Blake Rd
- 19 Vine St Unit 3
- 19 Vine St Unit 1
- 27 Ellen Ave
- 19 Ellen Ave
- 27 Greenvale Ave
- 36 Leslie Ave
- 25 Greenvale Ave
- 21 Greenvale Ave
- 31 Greenvale Ave
- 24 Leslie Ave
- 19 Greenvale Ave
- 15 Blanche Rd
- 28 Ellen Ave
- 20 Ellen Ave
- 39 Greenvale Ave
- 16 Ellen Ave
- 14 Blanche Rd
- 16 Leslie Ave
- 15 Greenvale Ave
- 10 Ellen Ave
- 26 Greenvale Ave Unit 17
- 53 Greenvale Ave