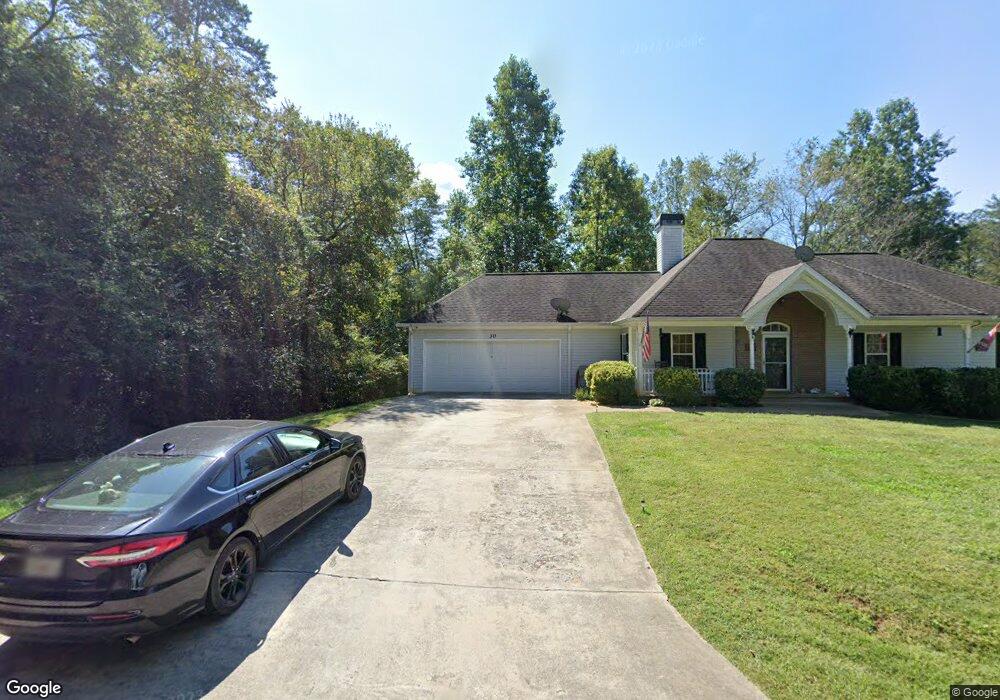
35 Long Branch Crossing Dahlonega, GA 30533
Estimated Value: $347,000 - $429,000
3
Beds
2
Baths
1,571
Sq Ft
$240/Sq Ft
Est. Value
About This Home
This home is located at 35 Long Branch Crossing, Dahlonega, GA 30533 and is currently estimated at $376,769, approximately $239 per square foot. 35 Long Branch Crossing is a home located in Lumpkin County with nearby schools including Clay County Middle School and Lumpkin County High School.
Ownership History
Date
Name
Owned For
Owner Type
Purchase Details
Closed on
Apr 10, 2025
Sold by
Brooks Lynne G
Bought by
Joyner Mary Elizabeth and Taylor Michele P
Current Estimated Value
Purchase Details
Closed on
Nov 12, 2024
Sold by
Messinger Robert Henry Trust
Bought by
Brooks Lynne G and Zike Michael E
Home Financials for this Owner
Home Financials are based on the most recent Mortgage that was taken out on this home.
Original Mortgage
$178,900
Interest Rate
6.44%
Mortgage Type
FHA
Purchase Details
Closed on
Jul 11, 2024
Sold by
Messinger Robert Henry
Bought by
Messinger Robert Henry Trust and Messinger Robert Henry
Purchase Details
Closed on
May 17, 2018
Sold by
Mills Gaylon
Bought by
Messinger Robert Henry
Purchase Details
Closed on
Jul 29, 2005
Sold by
Paitsel Billy
Bought by
Mills Gaylon and Mills Susan
Home Financials for this Owner
Home Financials are based on the most recent Mortgage that was taken out on this home.
Original Mortgage
$130,320
Interest Rate
1.25%
Mortgage Type
New Conventional
Purchase Details
Closed on
Oct 5, 2004
Sold by
Neil Ken
Bought by
Paitsel Billy
Purchase Details
Closed on
May 22, 2002
Sold by
Site Built Homes Inc
Bought by
Neil Ken
Purchase Details
Closed on
Aug 10, 2000
Sold by
Rymer Homes Inc
Bought by
Site Built Homes Inc
Create a Home Valuation Report for This Property
The Home Valuation Report is an in-depth analysis detailing your home's value as well as a comparison with similar homes in the area
Home Values in the Area
Average Home Value in this Area
Purchase History
| Date | Buyer | Sale Price | Title Company |
|---|---|---|---|
| Joyner Mary Elizabeth | -- | -- | |
| Brooks Lynne G | $359,900 | -- | |
| Messinger Robert Henry Trust | -- | -- | |
| Messinger Robert Henry | $187,500 | -- | |
| Mills Gaylon | $162,900 | -- | |
| Paitsel Billy | $35,000 | -- | |
| Neil Ken | $40,000 | -- | |
| Site Built Homes Inc | $235,000 | -- |
Source: Public Records
Mortgage History
| Date | Status | Borrower | Loan Amount |
|---|---|---|---|
| Previous Owner | Brooks Lynne G | $178,900 | |
| Previous Owner | Mills Gaylon | $130,320 |
Source: Public Records
Tax History Compared to Growth
Tax History
| Year | Tax Paid | Tax Assessment Tax Assessment Total Assessment is a certain percentage of the fair market value that is determined by local assessors to be the total taxable value of land and additions on the property. | Land | Improvement |
|---|---|---|---|---|
| 2024 | $90 | $111,739 | $7,368 | $104,371 |
| 2023 | $174 | $104,552 | $7,368 | $97,184 |
| 2022 | $246 | $92,486 | $7,368 | $85,118 |
| 2021 | $97 | $77,670 | $7,368 | $70,302 |
| 2020 | $78 | $75,646 | $7,368 | $68,278 |
| 2019 | $74 | $75,646 | $7,368 | $68,278 |
| 2018 | $1,749 | $63,648 | $7,368 | $56,280 |
| 2017 | $1,668 | $59,648 | $7,368 | $52,280 |
| 2016 | $1,573 | $54,584 | $7,368 | $47,216 |
| 2015 | $1,400 | $54,584 | $7,368 | $47,216 |
| 2014 | $1,400 | $55,108 | $7,368 | $47,740 |
| 2013 | -- | $55,632 | $7,368 | $48,264 |
Source: Public Records
Map
Nearby Homes
- 128 Young Deer Dr
- 87 Tolleffs Trail
- 202 Indian Trail
- 380 Copper Mill Rd
- 0 Arborwood Dr Unit 10645890
- 83 Austin Ct
- 260 Holly Ln
- 0 Bearden Rd Unit 10598024
- 0 Bearden Rd Unit 7642996
- 6480 Highway 52 W
- 1228 Winters Mountain Rd
- 300 Mountain Ridge Dr
- 0 Winters Mountain Rd Unit 7681054
- 0 Winters Mountain Rd Unit 10643431
- 496 Beaver Dam Rd
- 94 King Arthur Ct
- 962 Winters Mountain Rd
- 100 Rocky Branch Dr
- 45 Chestatee River Ridge
- 30 Long Branch Crossing
- 34 Long Branch Crossing
- 45 Long Branch Crossing
- 5422 Long Branch Rd Unit 50
- 5422 Long Branch Rd
- 5414 Long Branch Rd
- 5414 Long Branch Rd Unit 52
- 11 Long Branch Crossing Unit 5
- 90 Long Branch Crossing
- 135 Long Branch Crossing
- 112 Long Branch Crossing
- 35 Pecks Creek Ct
- 24 Pecks Creek Ct
- 0 Long Branch Crossing Unit 8835737
- 0 Long Branch Crossing Unit 7114231
- 0 Long Branch Crossing Unit 8198334
- 0 Long Branch Crossing Unit 8235098
- 0 Long Branch Crossing Unit 8247767
- 122 Long Branch Crossing
- 161 Long Branch Crossing