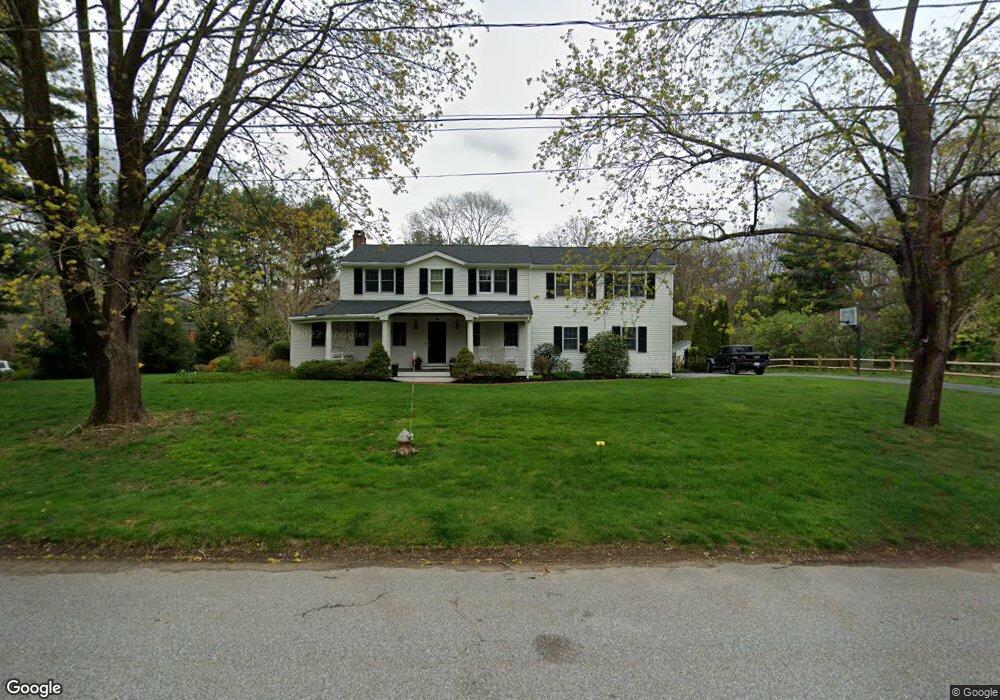
35 Longfellow Rd Concord, MA 01742
Estimated Value: $1,513,000 - $1,705,000
4
Beds
3
Baths
3,273
Sq Ft
$498/Sq Ft
Est. Value
About This Home
This home is located at 35 Longfellow Rd, Concord, MA 01742 and is currently estimated at $1,629,167, approximately $497 per square foot. 35 Longfellow Rd is a home located in Middlesex County with nearby schools including Willard School, Concord Middle School, and Concord Carlisle High School.
Ownership History
Date
Name
Owned For
Owner Type
Purchase Details
Closed on
Nov 16, 2025
Sold by
Fischelis Peter C and Fischelis Lori M
Bought by
Fischelis Rt and Fischelis
Current Estimated Value
Purchase Details
Closed on
Jan 5, 2020
Sold by
Fischelis Rt and Fischelis
Bought by
Fischelis Peter C and Fischelis Lori M
Purchase Details
Closed on
Mar 14, 2019
Sold by
Fishelis Peter C and Fishelis Lori M
Bought by
Fishelis Rt and Fishelis
Purchase Details
Closed on
Mar 8, 1993
Sold by
Fischelis William C and Fischelis Peter C
Bought by
Fischelis Peter C and Fischelis Lori M
Create a Home Valuation Report for This Property
The Home Valuation Report is an in-depth analysis detailing your home's value as well as a comparison with similar homes in the area
Home Values in the Area
Average Home Value in this Area
Purchase History
| Date | Buyer | Sale Price | Title Company |
|---|---|---|---|
| Fischelis Rt | -- | -- | |
| Fischelis Peter C | -- | None Available | |
| Fishelis Rt | -- | -- | |
| Fischelis Peter C | $105,000 | -- |
Source: Public Records
Mortgage History
| Date | Status | Borrower | Loan Amount |
|---|---|---|---|
| Previous Owner | Fischelis Peter C | $375,000 | |
| Previous Owner | Fischelis Peter C | $150,000 |
Source: Public Records
Tax History
| Year | Tax Paid | Tax Assessment Tax Assessment Total Assessment is a certain percentage of the fair market value that is determined by local assessors to be the total taxable value of land and additions on the property. | Land | Improvement |
|---|---|---|---|---|
| 2025 | $194 | $1,462,100 | $612,400 | $849,700 |
| 2024 | $19,197 | $1,462,100 | $612,400 | $849,700 |
| 2023 | $18,047 | $1,392,500 | $583,200 | $809,300 |
| 2022 | $16,862 | $1,142,400 | $466,500 | $675,900 |
| 2021 | $16,556 | $1,124,700 | $466,500 | $658,200 |
| 2020 | $16,174 | $1,136,600 | $466,500 | $670,100 |
| 2019 | $15,219 | $1,072,500 | $453,000 | $619,500 |
| 2018 | $14,617 | $1,022,900 | $411,800 | $611,100 |
| 2017 | $14,510 | $1,031,300 | $420,200 | $611,100 |
| 2016 | $14,435 | $1,037,000 | $420,200 | $616,800 |
| 2015 | $13,264 | $928,200 | $363,200 | $565,000 |
Source: Public Records
Map
Nearby Homes
- 367 Powder Mill Rd
- 56 Seymour St
- 32 Bolton St
- 89 Mattison Dr
- 40 Rookery Ln Unit 5
- 72 Rookery Ln Unit 3
- 132 Williams Rd
- 850 Old Road to 9 Acre Corner
- 1201 Old Marlboro Rd
- 56 Rookery Ln Unit 4
- 108 Hawks Perch Unit 108
- 401 Emery Ln Unit 304
- 2 Skyview Ln
- 497 Old Road to 9 Acre Corner
- 42 Dakin Rd
- 29 King Ln
- 53 Prairie St
- 47 Bridgecourt Ln
- 111 Central St
- 100 Harrington Ave
- 51 Longfellow Rd
- 38 Longfellow Rd
- 384 Powder Mill Rd
- 366 Powder Mill Rd
- 10 Longfellow Rd
- 400 Powder Mill Rd
- 400 Powder Mill Rd
- 154 Paul Revere Rd
- Lot 3A (C) Powder Mill Rd
- Lot 2 (B) Powder Mill Rd
- Lot C Powder Mill Rd
- Lot B Powder Mill Rd
- 22 Jennie Dugan Rd
- 414 Powder Mill Rd
- 30 Jennie Dugan Rd
- 125 Paul Revere Rd
- 140 Paul Revere Rd
- 385 Powder Mill Rd
- 346 Powder Mill Rd
- 401 Powder Mill Rd
Your Personal Tour Guide
Ask me questions while you tour the home.