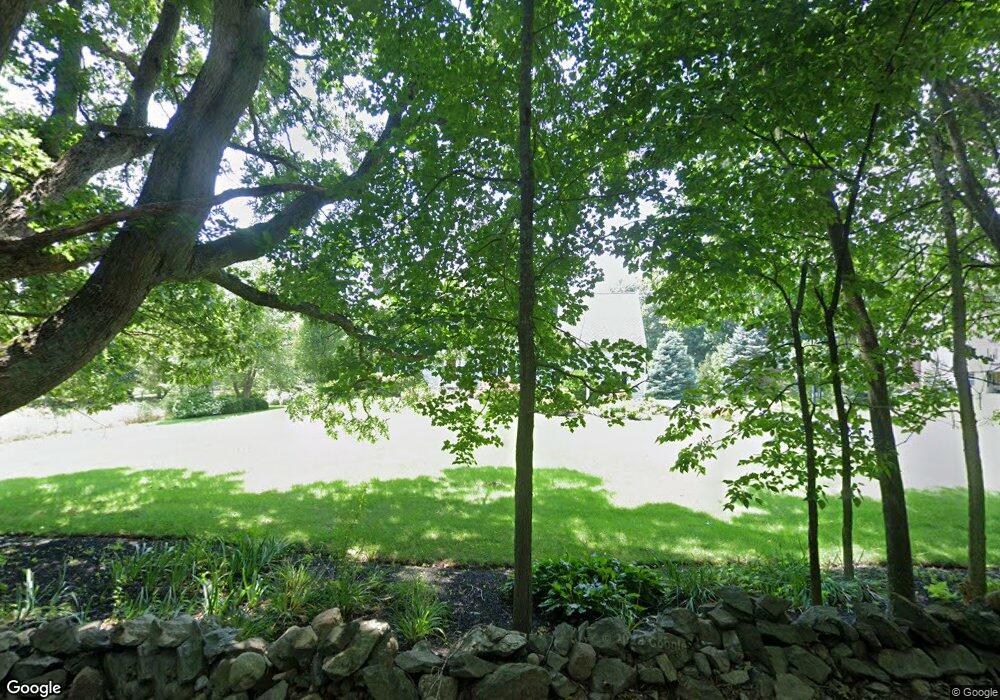
35 Luke St Wrentham, MA 02093
West Wrentham NeighborhoodEstimated Value: $983,647 - $1,099,000
4
Beds
3
Baths
3,188
Sq Ft
$329/Sq Ft
Est. Value
About This Home
This home is located at 35 Luke St, Wrentham, MA 02093 and is currently estimated at $1,048,912, approximately $329 per square foot. 35 Luke St is a home located in Norfolk County with nearby schools including Delaney Elementary School, Charles E Roderick, and Rise Prep Mayoral Academy Middle School.
Ownership History
Date
Name
Owned For
Owner Type
Purchase Details
Closed on
Jul 10, 2000
Sold by
Boisvert Gilbert E
Bought by
Vieira Daniel J and Vieira Jennifer L
Current Estimated Value
Purchase Details
Closed on
Sep 30, 1997
Sold by
Cherokee Dev Corp
Bought by
Amara James P and Amara Linda
Home Financials for this Owner
Home Financials are based on the most recent Mortgage that was taken out on this home.
Original Mortgage
$120,000
Interest Rate
7.47%
Mortgage Type
Purchase Money Mortgage
Create a Home Valuation Report for This Property
The Home Valuation Report is an in-depth analysis detailing your home's value as well as a comparison with similar homes in the area
Home Values in the Area
Average Home Value in this Area
Purchase History
| Date | Buyer | Sale Price | Title Company |
|---|---|---|---|
| Vieira Daniel J | $141,000 | -- | |
| Amara James P | $100,000 | -- |
Source: Public Records
Mortgage History
| Date | Status | Borrower | Loan Amount |
|---|---|---|---|
| Open | Amara James P | $1,700,000 | |
| Closed | Amara James P | $250,000 | |
| Previous Owner | Amara James P | $120,000 |
Source: Public Records
Tax History
| Year | Tax Paid | Tax Assessment Tax Assessment Total Assessment is a certain percentage of the fair market value that is determined by local assessors to be the total taxable value of land and additions on the property. | Land | Improvement |
|---|---|---|---|---|
| 2025 | $11,235 | $969,400 | $299,600 | $669,800 |
| 2024 | $10,668 | $889,000 | $299,600 | $589,400 |
| 2023 | $10,557 | $836,500 | $272,400 | $564,100 |
| 2022 | $10,183 | $744,900 | $245,600 | $499,300 |
| 2021 | $9,555 | $679,100 | $219,400 | $459,700 |
| 2020 | $10,241 | $718,700 | $200,400 | $518,300 |
| 2019 | $10,073 | $713,400 | $218,600 | $494,800 |
| 2018 | $8,527 | $598,800 | $218,200 | $380,600 |
| 2017 | $8,353 | $586,200 | $214,000 | $372,200 |
| 2016 | $8,180 | $572,800 | $207,800 | $365,000 |
| 2015 | $8,948 | $597,300 | $249,700 | $347,600 |
| 2014 | $8,962 | $585,400 | $240,200 | $345,200 |
Source: Public Records
Map
Nearby Homes
- 9 Pebble Cir Unit 9
- 65 Palmetto Dr Unit 65
- 21 Palmetto Dr Unit 21
- 24 Palmetto Dr Unit 24
- 20 Nature View Dr
- 25 Nature View Dr
- 1250 Pulaski Blvd
- 142 Stoneham Dr
- 10 Stoneham Dr
- 365 W Wrentham Rd
- 2095 West St
- 180 Pine Swamp Rd
- 56 Pine Swamp Rd
- 172 Pine Swamp Rd
- 245 W Wrentham Rd
- 202 Paine St
- 45 Lemay Rd
- 194 Paine St
- 21 Irving St
- 727 Mendon Rd
