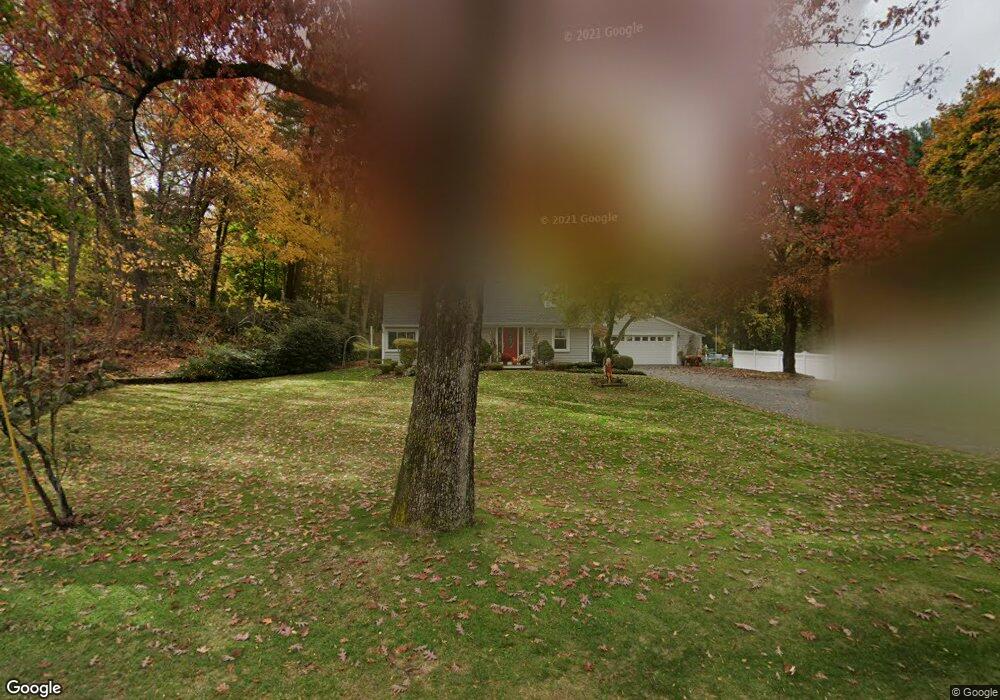
35 Main St Wilbraham, MA 01095
Estimated Value: $324,000 - $383,000
2
Beds
2
Baths
1,431
Sq Ft
$249/Sq Ft
Est. Value
About This Home
This home is located at 35 Main St, Wilbraham, MA 01095 and is currently estimated at $355,875, approximately $248 per square foot. 35 Main St is a home located in Hampden County with nearby schools including Minnechaug Regional High School, St. John the Baptist School, and Wilbraham & Monson Academy.
Ownership History
Date
Name
Owned For
Owner Type
Purchase Details
Closed on
Dec 15, 1987
Sold by
Hazel Hartwell Est
Bought by
Peck Lois
Current Estimated Value
Purchase Details
Closed on
Aug 4, 1987
Sold by
Lourie Natalie A
Bought by
Peck Lois
Home Financials for this Owner
Home Financials are based on the most recent Mortgage that was taken out on this home.
Original Mortgage
$50,000
Interest Rate
10.43%
Mortgage Type
Purchase Money Mortgage
Create a Home Valuation Report for This Property
The Home Valuation Report is an in-depth analysis detailing your home's value as well as a comparison with similar homes in the area
Home Values in the Area
Average Home Value in this Area
Purchase History
| Date | Buyer | Sale Price | Title Company |
|---|---|---|---|
| Peck Lois | $79,000 | -- | |
| Peck Lois | $79,000 | -- |
Source: Public Records
Mortgage History
| Date | Status | Borrower | Loan Amount |
|---|---|---|---|
| Previous Owner | Peck Lois | $50,000 |
Source: Public Records
Tax History Compared to Growth
Tax History
| Year | Tax Paid | Tax Assessment Tax Assessment Total Assessment is a certain percentage of the fair market value that is determined by local assessors to be the total taxable value of land and additions on the property. | Land | Improvement |
|---|---|---|---|---|
| 2025 | $5,840 | $326,600 | $80,100 | $246,500 |
| 2024 | $5,358 | $289,600 | $80,100 | $209,500 |
| 2023 | $5,829 | $276,300 | $80,100 | $196,200 |
| 2022 | $5,829 | $284,500 | $80,100 | $204,400 |
| 2021 | $5,288 | $230,300 | $85,700 | $144,600 |
| 2020 | $5,154 | $230,300 | $85,700 | $144,600 |
| 2019 | $5,023 | $230,400 | $85,700 | $144,700 |
| 2018 | $4,845 | $214,000 | $85,700 | $128,300 |
| 2017 | $4,708 | $214,000 | $85,700 | $128,300 |
| 2016 | $4,843 | $224,200 | $95,500 | $128,700 |
| 2015 | $4,364 | $209,000 | $95,500 | $113,500 |
Source: Public Records
Map
Nearby Homes
- 2 Vista Rd
- 35 Lake Dr
- 54 High Pine Cir
- 4 Hillcrest Dr
- 69 High Pine Cir
- 182 Mountain Rd
- 88-90 Miller St
- 46 Washington Rd
- 28 Decorie Dr
- 20 Old Orchard Rd
- 474-480 Mountain Rd
- 38 King Dr
- 2 Bayberry Dr Unit 51
- 22 Balsam Hill Rd
- 229 Miller St Unit F-13
- 229 Miller St Unit C-1
- 229 Miller St Unit B2
- 474 Mountain Rd
- 319 Ventura St
- 19 Linwood Dr