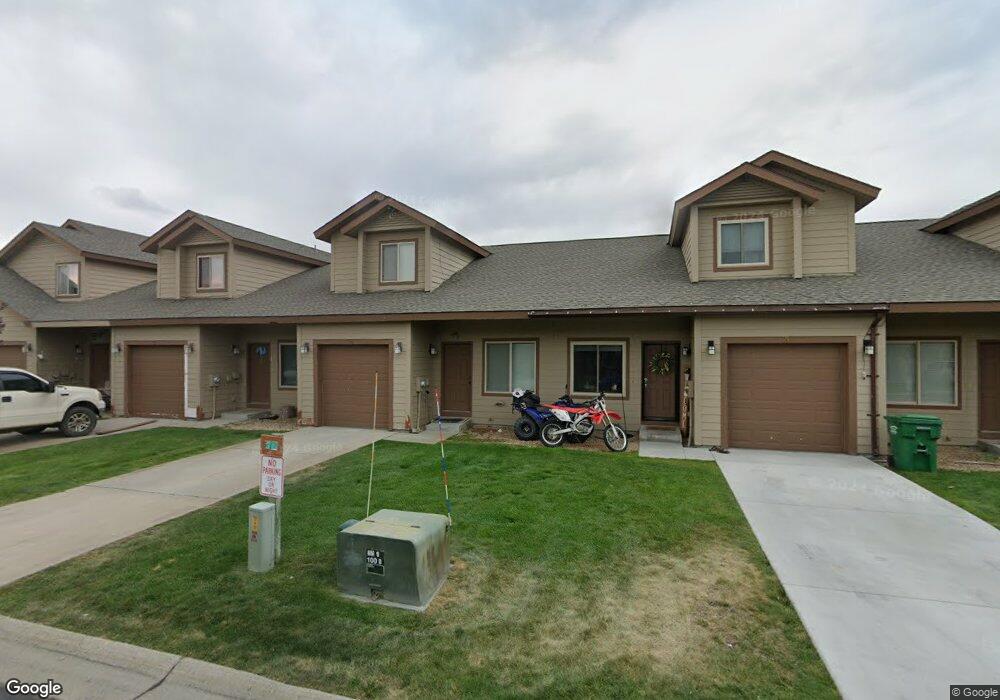
35 Mangum Cir Unit 2 Donnelly, ID 83615
Estimated Value: $356,000 - $392,000
3
Beds
2
Baths
1,389
Sq Ft
$270/Sq Ft
Est. Value
About This Home
This home is located at 35 Mangum Cir Unit 2, Donnelly, ID 83615 and is currently estimated at $375,219, approximately $270 per square foot. 35 Mangum Cir Unit 2 is a home located in Valley County with nearby schools including Donnelly Elementary School and McCall-Donnelly High School.
Ownership History
Date
Name
Owned For
Owner Type
Purchase Details
Closed on
Jun 17, 2025
Sold by
Dimitriu Dragos and Dimitriu Emilia
Bought by
Dimitriu Family Trust and Dimitriu
Current Estimated Value
Purchase Details
Closed on
May 11, 2018
Sold by
Dimitriu Dragos and Dimitriu Emilia
Bought by
Dimitriu Dragos and Dimitriu Emilia
Home Financials for this Owner
Home Financials are based on the most recent Mortgage that was taken out on this home.
Original Mortgage
$85,000
Interest Rate
4%
Mortgage Type
Adjustable Rate Mortgage/ARM
Purchase Details
Closed on
May 10, 2011
Sold by
Us Bank Na
Bought by
Dimitriu Dragos and Deac Emilia
Home Financials for this Owner
Home Financials are based on the most recent Mortgage that was taken out on this home.
Original Mortgage
$50,400
Interest Rate
4.84%
Mortgage Type
New Conventional
Purchase Details
Closed on
Aug 23, 2006
Sold by
Timberline Development Llc
Bought by
Durham Carmine J and Durham Jennifer L
Create a Home Valuation Report for This Property
The Home Valuation Report is an in-depth analysis detailing your home's value as well as a comparison with similar homes in the area
Home Values in the Area
Average Home Value in this Area
Purchase History
| Date | Buyer | Sale Price | Title Company |
|---|---|---|---|
| Dimitriu Family Trust | -- | Title One | |
| Dimitriu Dragos | -- | First American Title Insuran | |
| Dimitriu Dragos | -- | -- | |
| Durham Carmine J | -- | -- |
Source: Public Records
Mortgage History
| Date | Status | Borrower | Loan Amount |
|---|---|---|---|
| Previous Owner | Dimitriu Dragos | $85,000 | |
| Previous Owner | Dimitriu Dragos | $50,400 |
Source: Public Records
Tax History Compared to Growth
Tax History
| Year | Tax Paid | Tax Assessment Tax Assessment Total Assessment is a certain percentage of the fair market value that is determined by local assessors to be the total taxable value of land and additions on the property. | Land | Improvement |
|---|---|---|---|---|
| 2025 | $1,101 | $391,112 | $23,899 | $367,213 |
| 2023 | $1,101 | $448,597 | $24,658 | $423,939 |
| 2022 | $1,228 | $400,515 | $24,658 | $375,857 |
| 2021 | $1,107 | $229,910 | $18,968 | $210,942 |
| 2020 | $1,037 | $179,115 | $21,154 | $157,961 |
| 2019 | $864 | $135,549 | $20,147 | $115,402 |
| 2018 | $822 | $121,916 | $17,212 | $104,704 |
| 2017 | $872 | $118,501 | $20,597 | $97,904 |
| 2016 | $813 | $108,275 | $19,000 | $89,275 |
| 2015 | $357 | $89,368 | $0 | $0 |
| 2013 | -- | $86,925 | $0 | $0 |
Source: Public Records
Map
Nearby Homes
- 32 Mangum Cir Unit 3
- 32 Mangum Cir
- 35 1 Mangum Cir
- 35 Mangum Cir Unit 1
- 34 Mangum Cir Unit 8
- 24 Mangum Dr Unit # 1 Unit 1
- 20 Mangum Cir Unit 8
- 24 Mangum Cir Unit 1
- 20 #5 W Mangum Cir Unit 5
- 1816 Schultz
- 1816 Schultz Unit 15
- Lot 6 Hideout Dr Unit 6
- Lot 4 Hideout Dr Unit 4
- 13130 Crane Shore Dr
- 13116 Crane Shores Dr
- 13116 Crane Shore Dr
- TBD Herons Nest Ct
- 13111 Cameron Dr
- 22 Charters Dr
- 16 Buckskin Dr
- 35 Mangum Cir Unit 7
- 35 Mangum Cir Unit 8
- 35 Mangum Cir Unit 1
- 35 Mangum Cir Unit 3
- 35 Mangum Cir Unit 4
- 35 Mangum Cir Unit 5
- 35 Mangum Cir Unit 6
- 35 Mangum Cir Unit 7
- 35 Mangum Cir Unit 8
- 35 Mangum Cir
- 35 Mangum Cir
- 35 Mangum Cir
- 35 Mangum Cir
- 35 Mangum Cir
- 35 Mangum Cir Unit 4
- 35 Mangum Cir Unit 3
- 35 Mangum Cir Unit 8
- 35 Mangum Cir
- 35 Mangum Cir
- 35 Mangum Cir