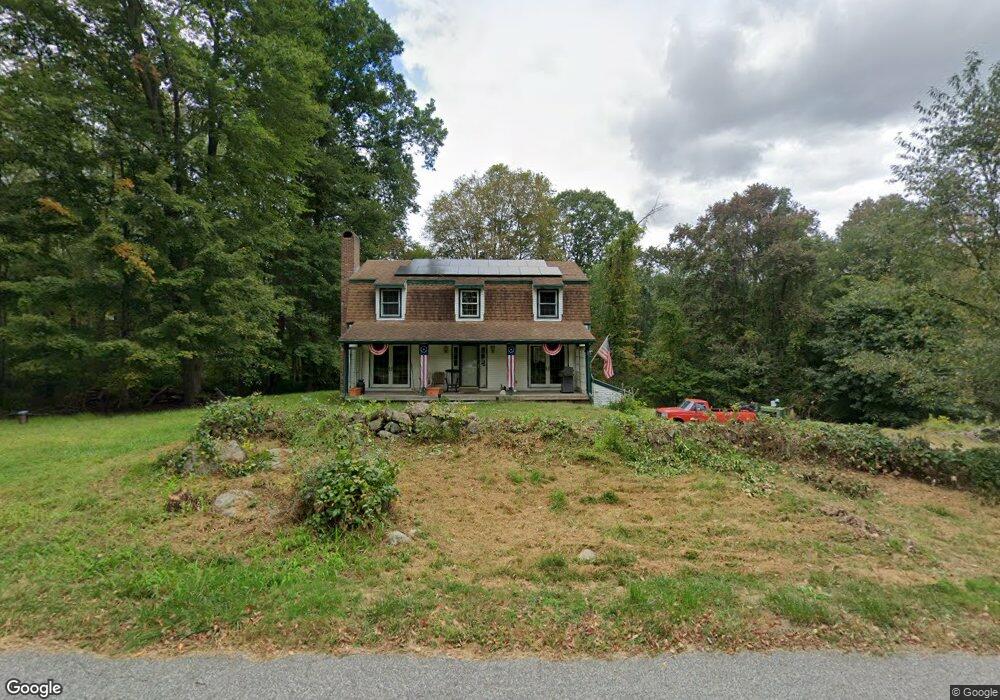
35 Maple Ave East Haddam, CT 06423
Estimated Value: $537,548 - $664,000
3
Beds
4
Baths
1,924
Sq Ft
$304/Sq Ft
Est. Value
About This Home
This home is located at 35 Maple Ave, East Haddam, CT 06423 and is currently estimated at $584,387, approximately $303 per square foot. 35 Maple Ave is a home located in Middlesex County with nearby schools including East Haddam Elementary School, Nathan Hale-Ray Middle School, and Nathan Hale-Ray High School.
Ownership History
Date
Name
Owned For
Owner Type
Purchase Details
Closed on
Apr 1, 1998
Sold by
Odea Thomas J
Bought by
Thisdale Jack M
Current Estimated Value
Home Financials for this Owner
Home Financials are based on the most recent Mortgage that was taken out on this home.
Original Mortgage
$33,000
Interest Rate
6.89%
Mortgage Type
Unknown
Create a Home Valuation Report for This Property
The Home Valuation Report is an in-depth analysis detailing your home's value as well as a comparison with similar homes in the area
Home Values in the Area
Average Home Value in this Area
Purchase History
| Date | Buyer | Sale Price | Title Company |
|---|---|---|---|
| Thisdale Jack M | $42,000 | -- |
Source: Public Records
Mortgage History
| Date | Status | Borrower | Loan Amount |
|---|---|---|---|
| Open | Thisdale Jack M | $248,000 | |
| Closed | Thisdale Jack M | $232,000 | |
| Closed | Thisdale Jack M | $189,500 | |
| Closed | Thisdale Jack M | $33,000 |
Source: Public Records
Tax History Compared to Growth
Tax History
| Year | Tax Paid | Tax Assessment Tax Assessment Total Assessment is a certain percentage of the fair market value that is determined by local assessors to be the total taxable value of land and additions on the property. | Land | Improvement |
|---|---|---|---|---|
| 2025 | $7,057 | $251,510 | $87,710 | $163,800 |
| 2024 | $6,730 | $251,510 | $87,710 | $163,800 |
| 2023 | $6,476 | $251,510 | $87,710 | $163,800 |
| 2022 | $6,146 | $193,340 | $66,500 | $126,840 |
| 2021 | $5,885 | $193,340 | $66,500 | $126,840 |
| 2020 | $5,885 | $193,340 | $66,500 | $126,840 |
| 2019 | $5,885 | $193,340 | $66,500 | $126,840 |
| 2018 | $5,734 | $193,340 | $66,500 | $126,840 |
| 2017 | $5,938 | $200,760 | $70,000 | $130,760 |
| 2016 | $5,892 | $200,760 | $70,000 | $130,760 |
| 2015 | $5,758 | $200,760 | $70,000 | $130,760 |
| 2014 | $5,601 | $200,760 | $70,000 | $130,760 |
Source: Public Records
Map
Nearby Homes
- 10 Orchard Rd
- 2 Morgan Ln
- 80 Orchard Rd
- 77 Main St
- 00 Mount Parnassus Rd
- 16 Mount Parnassus Rd
- 23 Main St
- 2 Norwich Rd
- 55 Bogel Rd
- 45 Alger Rd
- 1572 Saybrook Rd
- 40 & 42 Old Cart Rd
- 5 Joe Williams Rd
- 398 E Haddam Moodus Rd
- 67 Moodus Leesville Rd
- 53 Shanaghans Rd
- 2 Acorn Dr
- 53 Falls Rd
- 288 Middlesex Ave
- 195A Injun Hollow Rd