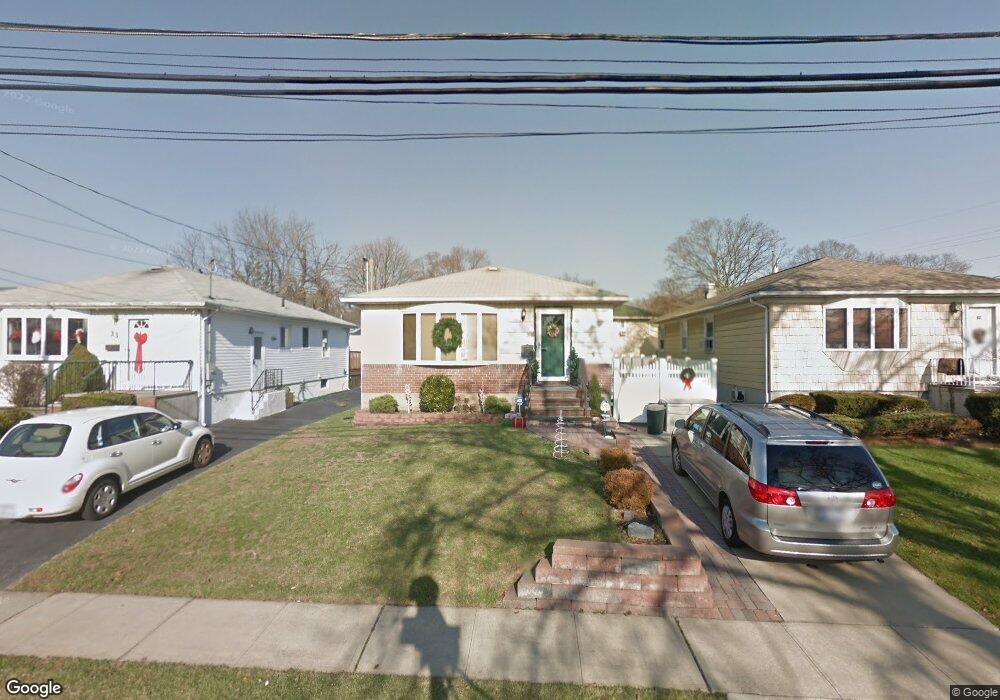
35 Maple St Massapequa, NY 11758
Estimated Value: $640,222 - $652,000
--
Bed
1
Bath
1,050
Sq Ft
$615/Sq Ft
Est. Value
About This Home
This home is located at 35 Maple St, Massapequa, NY 11758 and is currently estimated at $646,111, approximately $615 per square foot. 35 Maple St is a home located in Nassau County with nearby schools including Massapequa High School - Ames Campus, Berner Middle School, and Massapequa High School.
Ownership History
Date
Name
Owned For
Owner Type
Purchase Details
Closed on
Jun 25, 2021
Sold by
Santangelo Jared E and Santangelo Gina M
Bought by
Boller Elizabeth and Boller Christopher G
Current Estimated Value
Home Financials for this Owner
Home Financials are based on the most recent Mortgage that was taken out on this home.
Original Mortgage
$494,000
Outstanding Balance
$446,280
Interest Rate
2.9%
Mortgage Type
New Conventional
Estimated Equity
$199,831
Purchase Details
Closed on
Oct 8, 2002
Sold by
Racaniello Kathleen
Bought by
Santangelo Jared
Create a Home Valuation Report for This Property
The Home Valuation Report is an in-depth analysis detailing your home's value as well as a comparison with similar homes in the area
Home Values in the Area
Average Home Value in this Area
Purchase History
| Date | Buyer | Sale Price | Title Company |
|---|---|---|---|
| Boller Elizabeth | $520,000 | Stewart Title | |
| Boller Elizabeth | $520,000 | Stewart Title | |
| Boller Elizabeth | $520,000 | Stewart Title | |
| Santangelo Jared | $319,000 | -- | |
| Santangelo Jared | $319,000 | -- |
Source: Public Records
Mortgage History
| Date | Status | Borrower | Loan Amount |
|---|---|---|---|
| Open | Boller Elizabeth | $494,000 | |
| Closed | Boller Elizabeth | $494,000 |
Source: Public Records
Tax History Compared to Growth
Tax History
| Year | Tax Paid | Tax Assessment Tax Assessment Total Assessment is a certain percentage of the fair market value that is determined by local assessors to be the total taxable value of land and additions on the property. | Land | Improvement |
|---|---|---|---|---|
| 2025 | $9,972 | $350 | $137 | $213 |
| 2024 | $3,314 | $389 | $152 | $237 |
| 2023 | $10,407 | $393 | $154 | $239 |
| 2022 | $10,407 | $393 | $154 | $239 |
| 2021 | $8,856 | $378 | $148 | $230 |
| 2020 | $7,732 | $508 | $507 | $1 |
| 2019 | $2,921 | $544 | $543 | $1 |
| 2018 | $6,101 | $580 | $0 | $0 |
| 2017 | $6,101 | $754 | $672 | $82 |
| 2016 | $9,769 | $754 | $672 | $82 |
| 2015 | $3,292 | $754 | $672 | $82 |
| 2014 | $3,292 | $754 | $672 | $82 |
| 2013 | $2,994 | $754 | $672 | $82 |
Source: Public Records
Map
Nearby Homes
- 17 Linden St
- 54 Chestnut St
- 28 Grove St
- 5675 Merrick Rd
- 3969 Marlow Ct
- 3945 Hickory St
- 243 Seaford Ave
- 2067 Jackson Ave
- 230 W End Ave
- 3937 John Ln
- 138 Saint Marks Place
- 135 Ocean Ave
- 4 Sutton Place
- 3861 Hickory St
- 1872 Park Dr
- 344 Harrison Ave
- 4037 Park Dr
- 94 Alhambra Rd
- 5 Canal Rd
- 63 Pennsylvania Ave