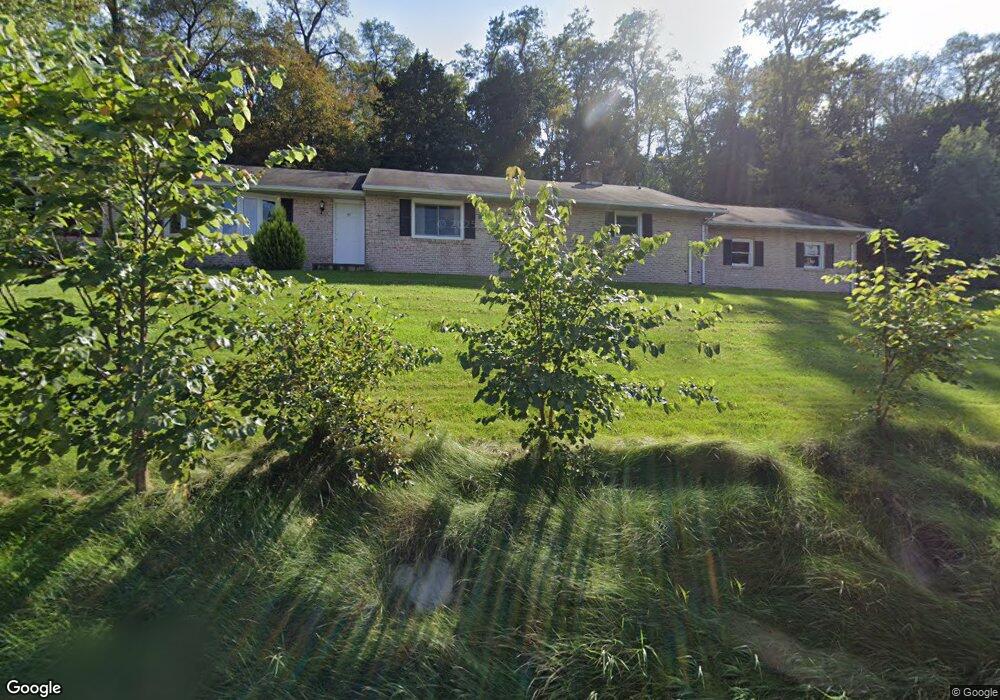
35 Maple St Mifflinburg, PA 17844
Estimated Value: $255,000 - $334,000
4
Beds
2
Baths
1,928
Sq Ft
$149/Sq Ft
Est. Value
About This Home
This home is located at 35 Maple St, Mifflinburg, PA 17844 and is currently estimated at $286,794, approximately $148 per square foot. 35 Maple St is a home located in Union County with nearby schools including Mifflinburg Elementary School, Mifflinburg Area Intermediate School, and Mifflinburg Area Middle School.
Ownership History
Date
Name
Owned For
Owner Type
Purchase Details
Closed on
Nov 12, 2015
Sold by
Fannie Mae
Bought by
Gaurer Robert Gary
Current Estimated Value
Home Financials for this Owner
Home Financials are based on the most recent Mortgage that was taken out on this home.
Original Mortgage
$96,000
Outstanding Balance
$75,992
Interest Rate
3.98%
Mortgage Type
New Conventional
Estimated Equity
$210,802
Purchase Details
Closed on
Jul 7, 2015
Sold by
Ritter Ernest R
Bought by
Federal National Mortgage Association
Create a Home Valuation Report for This Property
The Home Valuation Report is an in-depth analysis detailing your home's value as well as a comparison with similar homes in the area
Home Values in the Area
Average Home Value in this Area
Purchase History
| Date | Buyer | Sale Price | Title Company |
|---|---|---|---|
| Gaurer Robert Gary | $120,000 | Attorney | |
| Federal National Mortgage Association | $4,680 | None Available |
Source: Public Records
Mortgage History
| Date | Status | Borrower | Loan Amount |
|---|---|---|---|
| Open | Gaurer Robert Gary | $96,000 |
Source: Public Records
Tax History Compared to Growth
Tax History
| Year | Tax Paid | Tax Assessment Tax Assessment Total Assessment is a certain percentage of the fair market value that is determined by local assessors to be the total taxable value of land and additions on the property. | Land | Improvement |
|---|---|---|---|---|
| 2025 | $3,037 | $153,400 | $36,600 | $116,800 |
| 2024 | $3,037 | $153,400 | $36,600 | $116,800 |
| 2023 | $2,938 | $153,400 | $36,600 | $116,800 |
| 2022 | $2,924 | $153,400 | $36,600 | $116,800 |
| 2021 | $2,896 | $153,400 | $36,600 | $116,800 |
| 2020 | $2,829 | $153,400 | $36,600 | $116,800 |
| 2019 | $2,773 | $153,400 | $36,600 | $116,800 |
| 2018 | $2,715 | $153,400 | $36,600 | $116,800 |
| 2017 | $2,655 | $153,400 | $36,600 | $116,800 |
| 2016 | $2,519 | $153,400 | $36,600 | $116,800 |
| 2015 | -- | $153,400 | $36,600 | $116,800 |
| 2014 | -- | $153,400 | $36,600 | $116,800 |
Source: Public Records
Map
Nearby Homes