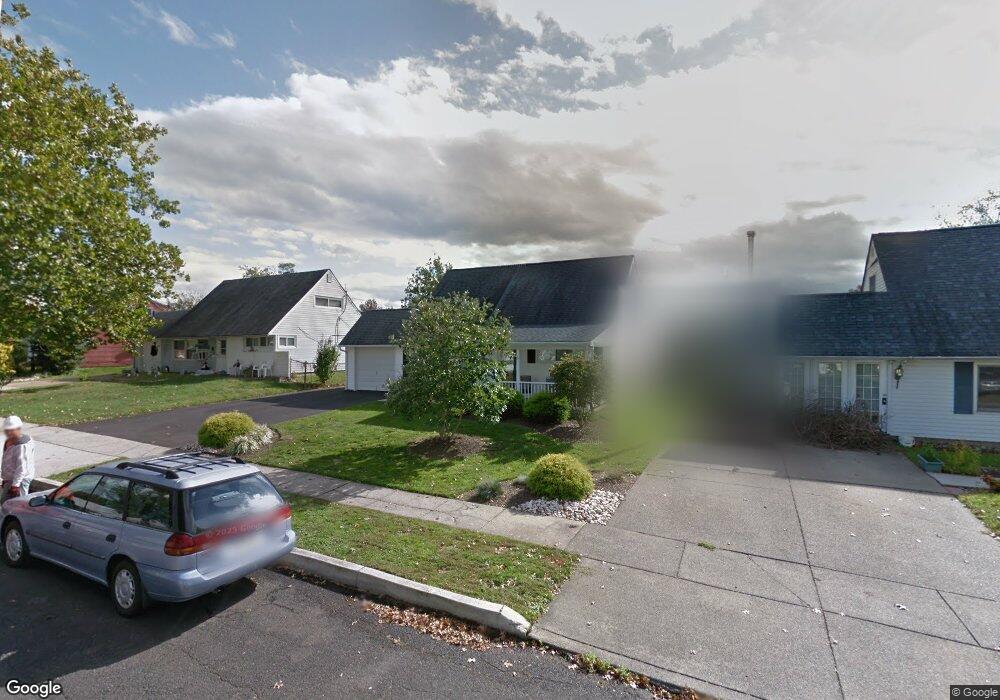
35 Mayflower Rd Levittown, PA 19056
Mill Creek Falls NeighborhoodEstimated Value: $349,000 - $422,000
3
Beds
2
Baths
1,238
Sq Ft
$310/Sq Ft
Est. Value
About This Home
This home is located at 35 Mayflower Rd, Levittown, PA 19056 and is currently estimated at $383,964, approximately $310 per square foot. 35 Mayflower Rd is a home located in Bucks County with nearby schools including Truman Senior High School, First Presbyterian Church School, and Emilie Christian Day School.
Ownership History
Date
Name
Owned For
Owner Type
Purchase Details
Closed on
Dec 9, 2005
Sold by
Houser Michael A
Bought by
Metzger Aileen J and Engel Robert F
Current Estimated Value
Home Financials for this Owner
Home Financials are based on the most recent Mortgage that was taken out on this home.
Original Mortgage
$138,000
Outstanding Balance
$77,533
Interest Rate
6.36%
Mortgage Type
Fannie Mae Freddie Mac
Estimated Equity
$306,431
Purchase Details
Closed on
Jan 17, 2002
Sold by
Hud and Carlson Lewis Arnold
Bought by
Houser Michael
Home Financials for this Owner
Home Financials are based on the most recent Mortgage that was taken out on this home.
Original Mortgage
$83,790
Interest Rate
7.14%
Purchase Details
Closed on
Oct 16, 2001
Sold by
Ge Capital Mtg Services Inc
Bought by
Hud
Purchase Details
Closed on
May 31, 2001
Sold by
Lawrence Kenneth D and Lawrence Patricia E
Bought by
Ge Capital Mtg Services Inc
Create a Home Valuation Report for This Property
The Home Valuation Report is an in-depth analysis detailing your home's value as well as a comparison with similar homes in the area
Home Values in the Area
Average Home Value in this Area
Purchase History
| Date | Buyer | Sale Price | Title Company |
|---|---|---|---|
| Metzger Aileen J | $229,000 | None Available | |
| Houser Michael | $88,200 | -- | |
| Hud | -- | -- | |
| Ge Capital Mtg Services Inc | $1,191 | -- |
Source: Public Records
Mortgage History
| Date | Status | Borrower | Loan Amount |
|---|---|---|---|
| Open | Metzger Aileen J | $138,000 | |
| Previous Owner | Houser Michael | $83,790 |
Source: Public Records
Tax History Compared to Growth
Tax History
| Year | Tax Paid | Tax Assessment Tax Assessment Total Assessment is a certain percentage of the fair market value that is determined by local assessors to be the total taxable value of land and additions on the property. | Land | Improvement |
|---|---|---|---|---|
| 2025 | $4,926 | $18,140 | $3,960 | $14,180 |
| 2024 | $4,926 | $18,140 | $3,960 | $14,180 |
| 2023 | $4,890 | $18,140 | $3,960 | $14,180 |
| 2022 | $4,890 | $18,140 | $3,960 | $14,180 |
| 2021 | $4,890 | $18,140 | $3,960 | $14,180 |
| 2020 | $4,890 | $18,140 | $3,960 | $14,180 |
| 2019 | $4,872 | $18,140 | $3,960 | $14,180 |
| 2018 | $4,793 | $18,140 | $3,960 | $14,180 |
| 2017 | $4,721 | $18,140 | $3,960 | $14,180 |
| 2016 | $4,721 | $18,140 | $3,960 | $14,180 |
| 2015 | $3,387 | $18,140 | $3,960 | $14,180 |
| 2014 | $3,387 | $17,200 | $3,960 | $13,240 |
Source: Public Records
Map
Nearby Homes