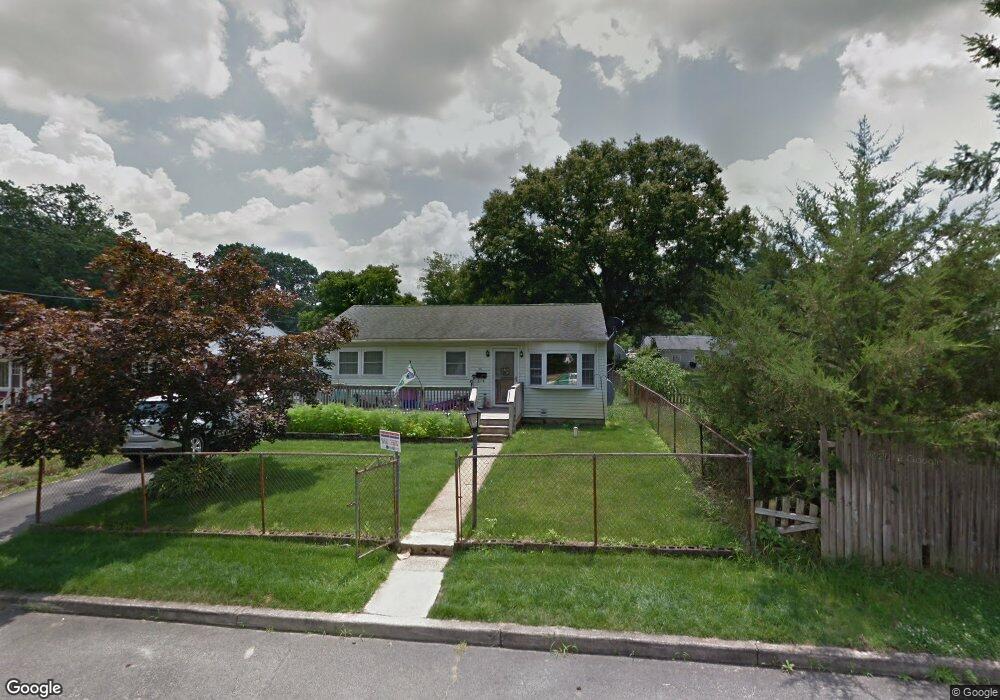
35 Meadowbrook Ln New Egypt, NJ 08533
Estimated Value: $269,000 - $337,000
3
Beds
1
Bath
1,916
Sq Ft
$150/Sq Ft
Est. Value
About This Home
This home is located at 35 Meadowbrook Ln, New Egypt, NJ 08533 and is currently estimated at $287,395, approximately $149 per square foot. 35 Meadowbrook Ln is a home located in Ocean County with nearby schools including Dr. Gerald H. Woehr Elementary School, New Egypt Middle School, and New Egypt High School.
Ownership History
Date
Name
Owned For
Owner Type
Purchase Details
Closed on
Mar 30, 2010
Sold by
Ervin Justin and Oday Stephanie
Bought by
Ervin Justin and Ervin Stephanie
Current Estimated Value
Home Financials for this Owner
Home Financials are based on the most recent Mortgage that was taken out on this home.
Original Mortgage
$195,105
Outstanding Balance
$129,947
Interest Rate
5%
Mortgage Type
FHA
Estimated Equity
$157,448
Purchase Details
Closed on
Sep 20, 2005
Sold by
Splitter Donald
Bought by
Ervin Justin and Oday Stephanie
Home Financials for this Owner
Home Financials are based on the most recent Mortgage that was taken out on this home.
Original Mortgage
$180,000
Interest Rate
8.75%
Mortgage Type
Fannie Mae Freddie Mac
Purchase Details
Closed on
Apr 12, 2002
Sold by
Aponte Carmen
Bought by
Splitter Donald
Home Financials for this Owner
Home Financials are based on the most recent Mortgage that was taken out on this home.
Original Mortgage
$100,024
Interest Rate
7.18%
Mortgage Type
FHA
Create a Home Valuation Report for This Property
The Home Valuation Report is an in-depth analysis detailing your home's value as well as a comparison with similar homes in the area
Home Values in the Area
Average Home Value in this Area
Purchase History
| Date | Buyer | Sale Price | Title Company |
|---|---|---|---|
| Ervin Justin | -- | Summit Ridge Title Agency | |
| Ervin Justin | $180,000 | -- | |
| Splitter Donald | $84,000 | -- |
Source: Public Records
Mortgage History
| Date | Status | Borrower | Loan Amount |
|---|---|---|---|
| Open | Ervin Justin | $195,105 | |
| Closed | Ervin Justin | $180,000 | |
| Previous Owner | Splitter Donald | $100,024 |
Source: Public Records
Tax History Compared to Growth
Tax History
| Year | Tax Paid | Tax Assessment Tax Assessment Total Assessment is a certain percentage of the fair market value that is determined by local assessors to be the total taxable value of land and additions on the property. | Land | Improvement |
|---|---|---|---|---|
| 2025 | $3,792 | $121,900 | $52,000 | $69,900 |
| 2024 | $3,539 | $121,900 | $52,000 | $69,900 |
| 2023 | $3,377 | $121,900 | $52,000 | $69,900 |
| 2022 | $3,377 | $121,900 | $52,000 | $69,900 |
| 2021 | $3,258 | $121,900 | $52,000 | $69,900 |
| 2020 | $3,183 | $121,900 | $52,000 | $69,900 |
| 2019 | $3,117 | $121,900 | $52,000 | $69,900 |
| 2018 | $3,172 | $121,900 | $52,000 | $69,900 |
| 2017 | $3,117 | $121,900 | $52,000 | $69,900 |
| 2016 | $3,072 | $121,900 | $52,000 | $69,900 |
| 2015 | $2,985 | $121,900 | $52,000 | $69,900 |
| 2014 | $2,916 | $121,900 | $52,000 | $69,900 |
Source: Public Records
Map
Nearby Homes
- 33 Fort Ave
- 12 Keeneland Rd
- 31 Fort Ave
- 7 Front St
- 28 Oakford Ave
- 6 Terrace Ave
- 40 Aqueduct Blvd
- 67 Aqueduct Blvd
- 23 Gulfstream Rd
- 62 Jacobstown Rd
- 71 Jacobstown Rd
- 70-72 Jacobstown Rd
- 55 N Main St
- 9 Saratoga Rd
- 18 Chepstow Rd
- 20 Belmont Rd
- 92 Jacobstown Rd
- 55 Churchill Blvd
- 31 Cedar St
- 137 Churchill Blvd