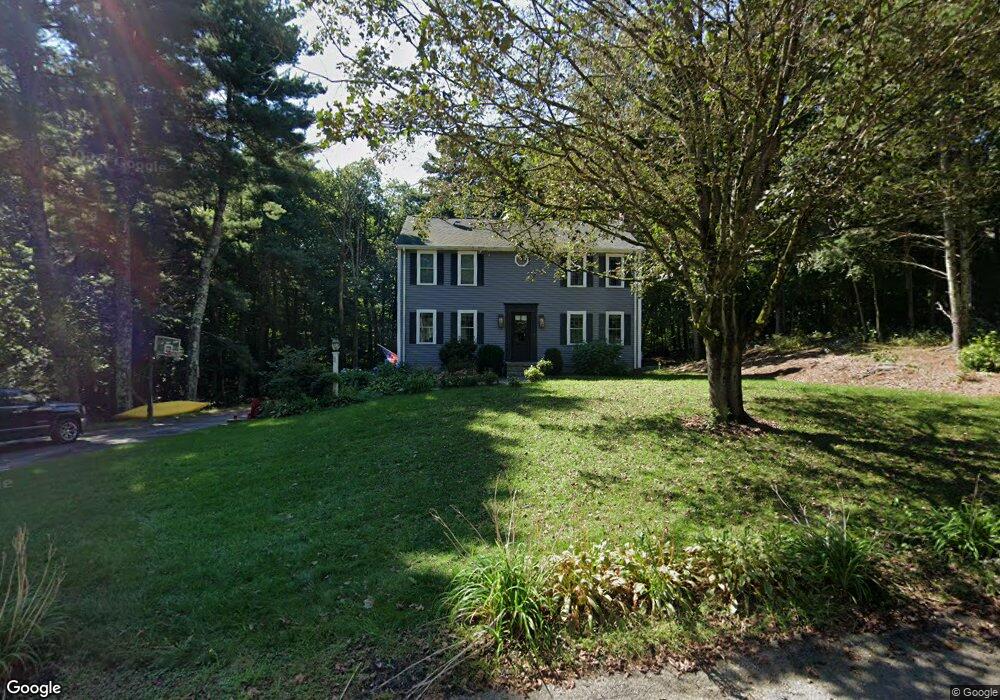
35 Metacomet St Wrentham, MA 02093
Estimated Value: $731,000 - $829,000
3
Beds
3
Baths
1,980
Sq Ft
$386/Sq Ft
Est. Value
About This Home
This home is located at 35 Metacomet St, Wrentham, MA 02093 and is currently estimated at $763,522, approximately $385 per square foot. 35 Metacomet St is a home located in Norfolk County with nearby schools including Delaney Elementary School and Charles E Roderick.
Ownership History
Date
Name
Owned For
Owner Type
Purchase Details
Closed on
Oct 25, 2004
Sold by
Danson Donald A and Danson Susan E
Bought by
Donald A Danson T
Current Estimated Value
Home Financials for this Owner
Home Financials are based on the most recent Mortgage that was taken out on this home.
Original Mortgage
$296,000
Interest Rate
5.85%
Mortgage Type
Purchase Money Mortgage
Purchase Details
Closed on
Aug 17, 2004
Sold by
Danson Susan E
Bought by
Donald A Danson T
Purchase Details
Closed on
Jul 1, 2002
Sold by
Kraby William A and Kraby Maureen T
Bought by
Danson Susan E
Home Financials for this Owner
Home Financials are based on the most recent Mortgage that was taken out on this home.
Original Mortgage
$276,000
Interest Rate
6.92%
Mortgage Type
Purchase Money Mortgage
Purchase Details
Closed on
Jan 27, 1989
Sold by
Solomon Robert J
Bought by
Kraby William A
Create a Home Valuation Report for This Property
The Home Valuation Report is an in-depth analysis detailing your home's value as well as a comparison with similar homes in the area
Home Values in the Area
Average Home Value in this Area
Purchase History
| Date | Buyer | Sale Price | Title Company |
|---|---|---|---|
| Donald A Danson T | -- | -- | |
| Donald A Danson T | -- | -- | |
| Danson Susan E | $345,000 | -- | |
| Kraby William A | $208,500 | -- |
Source: Public Records
Mortgage History
| Date | Status | Borrower | Loan Amount |
|---|---|---|---|
| Open | Kraby William A | $269,000 | |
| Closed | Donald A Danson T | $296,000 | |
| Previous Owner | Danson Susan E | $276,000 | |
| Previous Owner | Kraby William A | $53,006 | |
| Previous Owner | Kraby William A | $45,000 |
Source: Public Records
Tax History Compared to Growth
Tax History
| Year | Tax Paid | Tax Assessment Tax Assessment Total Assessment is a certain percentage of the fair market value that is determined by local assessors to be the total taxable value of land and additions on the property. | Land | Improvement |
|---|---|---|---|---|
| 2025 | $7,316 | $631,200 | $314,300 | $316,900 |
| 2024 | $7,121 | $593,400 | $314,300 | $279,100 |
| 2023 | $6,835 | $541,600 | $285,800 | $255,800 |
| 2022 | $6,310 | $461,600 | $245,300 | $216,300 |
| 2021 | $6,310 | $448,500 | $257,800 | $190,700 |
| 2020 | $5,483 | $384,800 | $182,500 | $202,300 |
| 2019 | $5,415 | $383,500 | $190,400 | $193,100 |
| 2018 | $5,612 | $394,100 | $190,600 | $203,500 |
| 2017 | $5,486 | $385,000 | $186,900 | $198,100 |
| 2016 | $5,401 | $378,200 | $181,500 | $196,700 |
| 2015 | $5,304 | $354,100 | $174,500 | $179,600 |
| 2014 | $5,215 | $340,600 | $167,800 | $172,800 |
Source: Public Records
Map
Nearby Homes
- 570 Franklin St
- 131 Creek St Unit 7
- Lot 3 - 14 Earle Stewart Ln
- 11 Earle Stewart Ln
- Lot 1 - Blueberry 2 Car Plan at King Philip Estates
- Lot 8 - Blueberry 2 Car Plan at King Philip Estates
- Lot 5 - Hughes 2 car Plan at King Philip Estates
- Lot 6 - Blueberry 3 Car Plan at King Philip Estates
- Lot 2 - Camden 2 Car Plan at King Philip Estates
- Lot 7 - Cedar Plan at King Philip Estates
- Lot 4 - Hemingway 2 Car Plan at King Philip Estates
- Lot 3 - Blueberry 2 Car Plan at King Philip Estates
- 10 Nature View Dr
- 15 Nature View Dr
- 50 Reed Fulton Ave Unit Lot 61
- 45 Joshua Rd
- 319 Taunton St
- 270 Dedham St
- 1 Lorraine Metcalf Dr
- 246 Forest Grove Ave
- 25 Metacomet St
- 45 Metacomet St
- 60 Gilmore Rd
- 40 Metacomet St
- 30 Metacomet St
- 15 Metacomet St
- 55 Metacomet St
- 50 Metacomet St
- 50 Gilmore Rd
- 20 Metacomet St
- 5 Metacomet St
- 40 Gilmore Rd
- 40 Gilmore Rd Unit B right sid
- 10 Metacomet St
- 60 Metacomet St
- 80 Gilmore Rd Unit 80
- 65 Metacomet St
- 71 Gilmore Rd
- 55 Gilmore Rd
- 100 Gilmore Rd