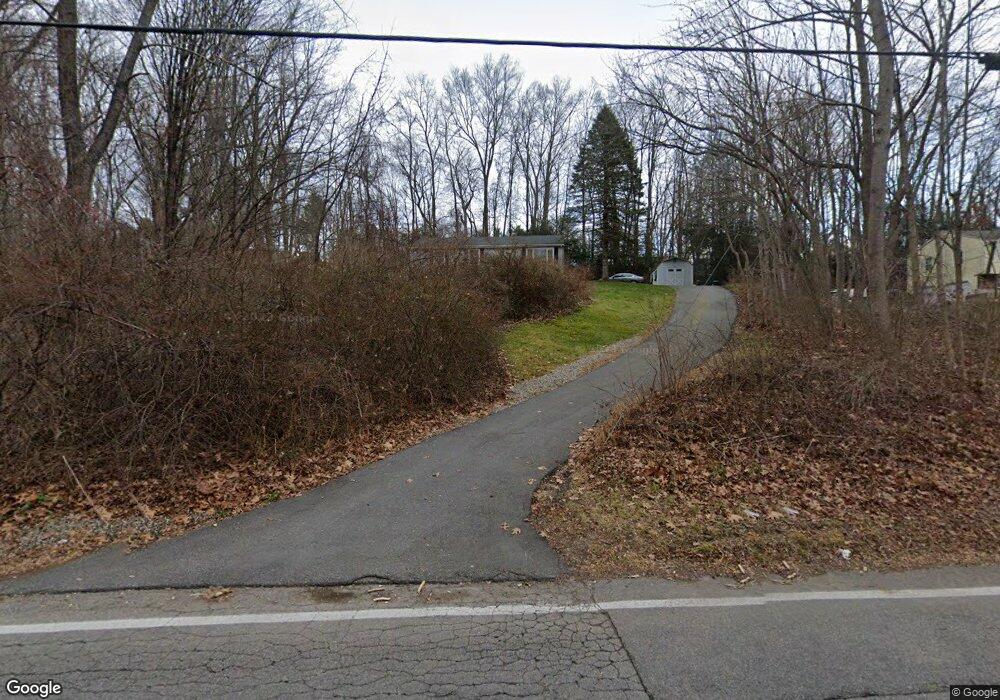
35 Mill Stream Rd Amston, CT 06231
Estimated Value: $338,441 - $366,000
3
Beds
1
Bath
1,247
Sq Ft
$285/Sq Ft
Est. Value
About This Home
This home is located at 35 Mill Stream Rd, Amston, CT 06231 and is currently estimated at $355,110, approximately $284 per square foot. 35 Mill Stream Rd is a home located in Tolland County with nearby schools including Gilead Hill School, Hebron Elementary School, and RHAM Middle School.
Ownership History
Date
Name
Owned For
Owner Type
Purchase Details
Closed on
May 22, 2024
Sold by
Martyszczyk Steven T
Bought by
Enslow Heather K
Current Estimated Value
Home Financials for this Owner
Home Financials are based on the most recent Mortgage that was taken out on this home.
Original Mortgage
$263,300
Outstanding Balance
$259,608
Interest Rate
6.88%
Mortgage Type
Purchase Money Mortgage
Estimated Equity
$95,502
Purchase Details
Closed on
Jan 17, 2003
Sold by
Phelps Daniel and Phelps Maureen
Bought by
Martyszcek Steven
Home Financials for this Owner
Home Financials are based on the most recent Mortgage that was taken out on this home.
Original Mortgage
$155,769
Interest Rate
6.18%
Purchase Details
Closed on
May 31, 1996
Sold by
Romano Andrew and Romano Gail
Bought by
Phelps Daniel and Phelps Maureen
Create a Home Valuation Report for This Property
The Home Valuation Report is an in-depth analysis detailing your home's value as well as a comparison with similar homes in the area
Home Values in the Area
Average Home Value in this Area
Purchase History
| Date | Buyer | Sale Price | Title Company |
|---|---|---|---|
| Enslow Heather K | $302,000 | None Available | |
| Enslow Heather K | $302,000 | None Available | |
| Martyszcek Steven | $157,000 | -- | |
| Phelps Daniel | $119,900 | -- | |
| Martyszcek Steven | $157,000 | -- | |
| Phelps Daniel | $119,900 | -- |
Source: Public Records
Mortgage History
| Date | Status | Borrower | Loan Amount |
|---|---|---|---|
| Open | Enslow Heather K | $263,300 | |
| Closed | Enslow Heather K | $263,300 | |
| Previous Owner | Phelps Daniel | $127,000 | |
| Previous Owner | Phelps Daniel | $15,000 | |
| Previous Owner | Phelps Daniel | $155,769 |
Source: Public Records
Tax History
| Year | Tax Paid | Tax Assessment Tax Assessment Total Assessment is a certain percentage of the fair market value that is determined by local assessors to be the total taxable value of land and additions on the property. | Land | Improvement |
|---|---|---|---|---|
| 2025 | $5,538 | $150,290 | $52,920 | $97,370 |
| 2024 | $5,185 | $150,290 | $52,920 | $97,370 |
| 2023 | $4,988 | $150,290 | $52,920 | $97,370 |
| 2022 | $4,764 | $150,290 | $52,920 | $97,370 |
| 2021 | $4,801 | $132,160 | $52,910 | $79,250 |
| 2020 | $4,801 | $132,160 | $52,910 | $79,250 |
| 2019 | $4,897 | $132,160 | $52,910 | $79,250 |
| 2018 | $4,948 | $132,160 | $52,910 | $79,250 |
| 2017 | $4,890 | $132,160 | $52,910 | $79,250 |
| 2016 | $5,222 | $146,510 | $87,080 | $59,430 |
| 2015 | $5,274 | $146,510 | $87,080 | $59,430 |
| 2014 | $5,238 | $146,510 | $87,080 | $59,430 |
Source: Public Records
Map
Nearby Homes
- 65 Wellswood Rd
- 64 Loveland Rd
- 00 Zola Rd
- 1 Church St
- 2 Church St
- 2 Summit Rd
- 389 Route 66
- 13 Basket Shop Rd
- 47 East St
- 146 Lake Shore Dr
- 0 Ryan Terrace Unit 24144446
- 0 Deepwood Dr
- 33 Northam Rd
- 2 Lots on Deepwood Dr
- 47 Ledge Rd
- 161 Lake Williams Dr
- 25 Woodland Dr
- 30 Pepperbush Dr
- 31 Crouch Rd
- 0 Park Rd Unit 24130670
- 35 Millstream Rd
- 43 Millstream Rd
- 43 Mill Stream Rd
- 46 Wellswood Rd
- 47 Wellswood Rd
- 56 Wellswood Rd
- 49 Mill Stream Rd
- 42 Mill Stream Rd
- 34 Wellswood Rd
- 37 Wellswood Rd
- 62 Wellswood Rd
- 57 Wellswood Rd
- 57 Mill Stream Rd
- 80 Wellswood Rd Unit 5
- 80 Wellswood Rd Unit 20
- 80 Wellswood Rd Unit 15
- 80 Wellswood Rd Unit 26
- 80 Wellswood Rd Unit 27
- 80 Wellswood Rd Unit 11
- 80 Wellswood Rd Unit 25
Your Personal Tour Guide
Ask me questions while you tour the home.